Quantcast
Channel: SuppVersity - Nutrition and Exercise Science for Everyone
Viewing all 1497 articles
Browse latest View live

Is »BAIBA« the Next Big Thing in Fat Loss Supplements? 24% Reduction in Fat Gain is an Impressive Number, But...

$
0
0
Could BIBA be the active ingredient in a pill that solves your weight problems once and for all? Or is that too good be true?
Beta-aminoisobutyric acid, aka BAIBA, is a natural catabolite of thymine. As with many other purported "next big things in fat loss supplements", early rodent studies suggest that it can significantly reduce body fatness through a mechanism that appears to involve increases in fatty acid oxidation (FAO) and reductions in de novo lipogenesis - in particular in the liver (Maisonneuve. 2003 & 2004; Begriche. 2008).

As Karima Begrich et al. point out in a more recent review of the literature, "experimental evidence [... also] suggested that BAIBA could reduce body adiposity through increased leptin expression and secretion" (Begriche. 2010).
Some people say that caffeine is the last real "fat burner" left on the market

Remember: With Coffee More Won't Help More

Coffee - The Good, Bad & Interesting

Three Cups of Coffee Keep Insulin At Bay

Caffeine's Effect on Testosterone, Estrogen & SHBG

The Coffee³ Ad- vantage: Fat loss, Appetite & Mood

Caffeine Resis- tance - Does It Even Exist?
Against that background, it is only logical to ask whether we have overlooked a potent natural fat burner with a mechanism of cation that may be beneficial for both losing fat (increase in fat oxidation and decrease in fat storage) and keeping it off (modulation of leptin expression and secretion).

Unfortunately, it does not take long to find the first evidence that blows a hole into the neat "BAIBA could solve the diabesity epidemic"-theory. It comes right from one of the previously cited studies.
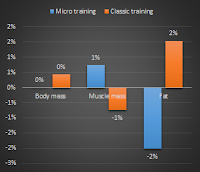
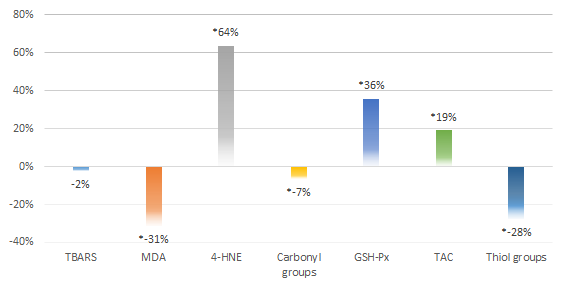
In their 2008 study, Begriche et al. were able to confirm that the provision of 100mg/kg per day (for humans that would be ~8mg/kg per day) of Beta-aminoisobutyric acid triggers significant reductions in body fat gain in lean mice (Figure 1, left).
Figure 1: 100mg/kg/day BAIBA may be an anti-weight gain supplement The data from obese rodents (rights) does yet suggest that it is not a weight loss supplement (Maisonneuve. 2004) | Anti-obesity, but not weight loss effects were also observed in obesity prone rodents in a 2008 study by Begrich et al. at the same dosage of BAIBA.
What the same amount of BAIBA did not do, though, was to prevent the weight gain in already obese mice (Figure 1, right). In view of the fact that the same discrepancies were observed for liver fat and total body weight (not shown in Figure 1), the currently available evidence clearly doesn't support the use of BAIBA as a classic "fat burner".
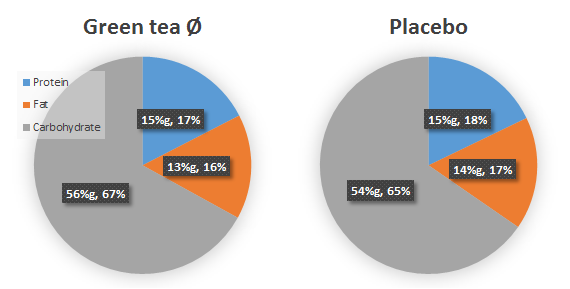
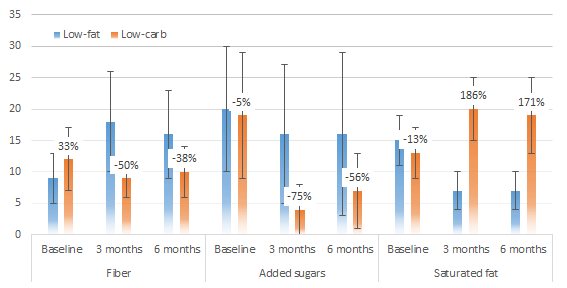
In obesity prone mice, BAIBA (100mg/kg) did not just ameliorate the body fat gain, it also reduced (c,d) the number of fibrotic leasons (a,b) of the liver that occured when the ob +/+ mice got fat (Begrich. 2008).
Is BAIBA even safe? In the absence of human studies that's difficult to say, but in rodents it had no ill effects on mtDNA replication (Mainonneuve. 2004) and displays a generally low toxicity. As Begrich et al. point out, their "further investigations are [still] requested to determine whether BAIBA could induce deleterious effects," even though, "it seems that this endogenous derivative could have a favourable safety profile that might be attractive for pharmacological usage" (Begrich. 2010). Deteriorations of the lipid or glucose metabolism, were not observed in any of the currently published studies and at a dosage of 100mg/kg BAIBA reduced the fibrotic leasons in the livers of obesity prone mice and improved the level of lactate dehydrogenase, a potential marker of liver problems (Begrich. 2008).
Overall, it does thus appear as if Begrich's own conclusion that BAIBA supplements "may be indeed an attractive pharmacological strategy in order to prevent (and/or treat) obesity" (Begrich. 2010) is only partly warranted:
  • While BAIBA may be useful to ameliorate the body fat gain in lean individuals and would thus in fact be an "attractive pharmacological strategy in order to prevent [...] obesity" (ibid.) in an obesogenic environment,
  • it appears to be more than just 'a little too early' to assume that BAIBA supplements could also be used to "treat" (ibid.) obesity in individuals who are already carrying >50% more body fat on their frame than the average lean person.
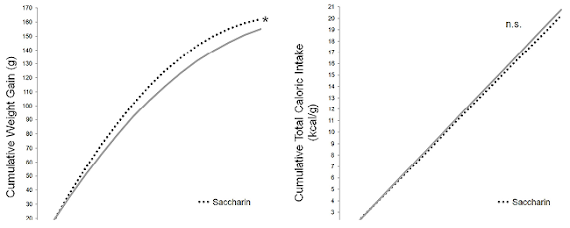
It is however more than the fact that many of you are probably (still) lean that keeps BAIBA in the game: If you look at the data in Figure 2, it becomes obvious that BAIBA may do more than to prevent the body fat gain in people who have always been lean: its effect on leptin, in particular, could be of even greater use for people who have lost a significant amount of body fat and are now struggling with the nasty yoyo effect.
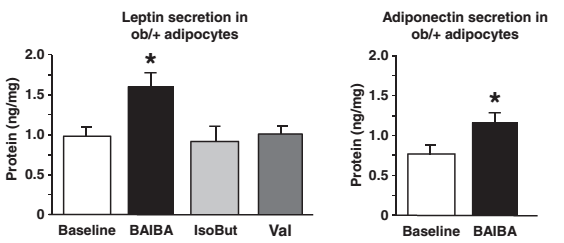
Figure 2: The increase in adipocyte (=fat cell) leptin and adiponectin production that was observed in the petri dish is particularly interesting for people who have already lost a significant amount of body fat (Begrich. 2010). If it translates into in vivo human studies, it may help those people to stay lean and reverse "metabolic damage".
As you can see in Figure 2, in vitro data shows that the direct exposure of fat cells (adipocytes) of mice, which are at a particularly high risk of becoming obese, will trigger a significant increase in leptin and adiponectin production. Why's that important? Well, of these...
  • Metabolic Damage, Energy Intake & the Human "Energy Thermostat" - An Update Based on Recent Studies | read it!
    the increase in adiponectin that is produced by one's fat cells has been linked to important health markers, like increased insulin sensitivity and improved markers of lipid management.
  • the increase in leptin production, however, may be of greater importance, because the diet- or rather fat-loss induced remodelling of the adipose tissue (many small empty fat cells) will reduce the production of the "you're fat enough" signal leptin and thus increase the risk of formerly obese individuals to regain every pound (or even more) of body fat they have painfully lost over months of hard dieting.
With that being said, the possibility that BAIBA may be able to reverse a potential cause of something that is often referred to as "metabolic damage" of which it appears as if it was at least partly triggered by a reduction in relative leptin production (i.e. the amount of leptin that is produced at a certain level of body fat) brings BAIBA back into the game. 
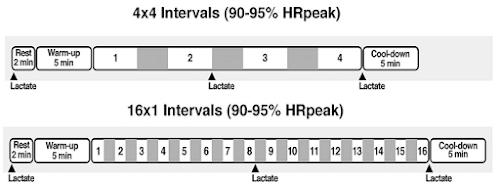
Bottom line: Whether an increase in leptin production is, as Figure 3 from Begrich's previously cited review suggests, the only (or at least the most important) mechanism of the beta-aminoisobutyric acid induced anti-obesity effect will yet have to be confirmed in future studies.

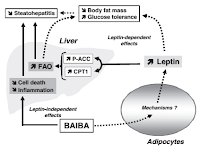
Figure 3: If Begrich et al. (2010) are right, the beneficial effects of BAIBA are mediated mostly, if not exclusively by leptin. Due to a lack of human data, BAIBA must - as of now - still be classified as "promising, but unproven" anti-obesity supplement.
Of even greater importance than investigations into what I would like to call the "leptin hypothesis of BAIBA's anti-obesity effects", though, is the simple confirmation of its effects in independent human studies. I mean, rodents are (often) a good model of human metabolism, but there are instances where slight metabolic differences between man and mouse can have a huge impact on several practically relevant research outcomes. It is thus well possible that unexpected human-specific "side effects" like an extreme increase in appetite and energy intake could reduce or blunt the purported anti-obesity prowess of BAIBA. Before the aforementioned human studies have not been conducted, peer-reviewed and published, I recommend to stay skeptical about BAIBA being the "next big thing in fat loss supplements." | Comment on Facebook!
References:
  • Begriche, Karima, et al. "β‐Aminoisobutyric Acid Prevents Diet‐induced Obesity in Mice With Partial Leptin Deficiency." Obesity 16.9 (2008): 2053-2067.
  • Begriche, Karima, Julie Massart, and Bernard Fromenty. "Effects of β‐aminoisobutyric acid on leptin production and lipid homeostasis: mechanisms and possible relevance for the prevention of obesity." Fundamental & clinical pharmacology 24.3 (2010): 269-282.
  • Maisonneuve, Caroline, et al. "Mitochondrial and metabolic effects of nucleoside reverse transcriptase inhibitors (NRTIs) in mice receiving one of five single-and three dual-NRTI treatments." Antimicrobial agents and chemotherapy 47.11 (2003): 3384-3392.
  • Maisonneuve, Caroline, et al. "Effects of zidovudine, stavudine and beta-aminoisobutyric acid on lipid homeostasis in mice: possible role in human fat wasting." Antiviral therapy 9.5 (2004): 801-810.

Muscle Regeneration & Hypertrophy Update: Vitamin D and Super-Slow Training - What Are They Good For?

$
0
0
Is it worth to replete vitamin D, but not to train super-slow, right?
No, I haven't dug up a study that deals with vitamin D and super-slow training at once, but I've found two very recent studies that are in one way or another related to muscle regeneration and hypertrophy and the way/s vitamin D and different training methods affect these outcomes. More specifically, the researchers investigated the effects of vitamin D (20OHD) repletion and the use of higher times-under-tension (TUT) and super-slow training.

Before I go ahead, though, I would like to point out that the long-term implications of some of the results are not totally obvious - a fact I will therefore (re-)address in the bottom line.
If you periodize appropriately you may actually be able to benefit from super-slow training.

30% More on the Big Three: Squat, DL, BP!

Block Periodization Done Right

Linear vs. Undulating Periodizationt

12% Body Fat in 12 Weeks W/ Periodizatoin

Detraining + Periodization - How to?

Tapering 101 - Learn How It's Done!
  • (Super-)slow training and its inferior effects on early-phase satellite cell and myonuclear domain adaptation (Herman-Montemayor. 2015) -- The purpose of one of the latest studies from the Rocky Vista University was to identify adaptations in satellite cell (SC) content and myonuclear domain (MND) after 6-week slow-speed vs. “normal-speed” resistance training programs.

    To this ends, thirty-four untrained women were divided into slow speed (SS), traditional strength (TS), traditional muscular endurance (TE), and nontraining control (C) groups. The ladies performed a leg work consisting of three sets of each of the following exercises twice per week in the first and thrice per week in the fifth week: Leg press, squat, and knee extensions. To investigate how the way these workouts were performed would affect the adaptive response, the scientists randomly assigned their subjects to four different groups:
    • The Super-Slow (SS) group performed 6– 10 repetition maximum (6–10RM) for each set with 10-second concentric (con) and 4-second eccentric (ecc) contractions for each repetition.
    • The Traditional Strength (TS) group and the Traditional Muscular Endurance (TE) group who performed 6–10RM and 20–30RM, respectively, at “normal” speed (1–2 seconds per con and ecc contractions).
    • The sedentary control group (C) which did not work out at all.
    To allow for a similar number of reps in the TS and SS group, the intensity (=weight used) in the SS group was reduced to the same 40–60% of the 1RM that was also used in the TE group. The TS group, on the other hand trained at 80–85% 1RM.
What do the changes in fiber type satellite cell increases actually tell us? Unfortunately, the answer to this question is by no means straight forward. In conjunction with the overall increase in domain sizes, cross sectional fiber size and myonuclear domain numbers (see Figure 1) the increased satellite cell recruitement in the traditional training group does yet support its superiority over super-slow training (learn more about satellite cells).
  • I know that this is not ideal, but there's no way you do 6-10 reps with a time-under-tension (TUT) of 10-0-4 with the same weight you'd do 6-10 reps at a normal TUT of 1-0-1 or 2-0-2, accordingly, the results the scientists' analysis of the pretraining and posttraining muscle biopsies the authors analyzed for fiber cross-sectional area, fiber type, SC content, myonuclear number, and MND still have practical relevance.
    Figure 1: Percentage change (%) in mean fiber cross-sectional area, myonuclear domain size (domain), and number of myonuclei per fiber cross-section (myonuclear number) from pretraining to posttraining for each group (TS, SS, TE, and C). *Significant increase after training, p , 0.001. §Significant increase after training, p # 0.05. #Significantly greater increase after training compared with all other groups (SS, TE, C), p , 0.01. TS = traditional strength (Herman-Montemayor. 2015).
    And what does the scientists' analysis tell us? Well, along with the data in Figure 1, the exclusive increase in satellite cell content of type I, IIA, fibers (IIX and IIAX increased in both SS and TS, but not TE or control) that was observed in the traditional strength (TS) training group appears to confirm the superiority of this way of training when it comes to lying the foundations of further myonuclear domain growth (learn more in the "Muscle Hypertrophy 101").

    The fact that myonuclear domain increases of type I, IIAX, and IIX fibers occurred exclusively in the TS, yet not in the SS group, where only the domains of the type IIA fibers increased, does still appear to confirm the common prejudice that - for the average trainee - training at higher times under tension (TUTs) does not offer benefits that suggest faster or more robust size gains. Compared to strength-endurance training, however, super-slow training is still the better option. On a "per load basis" it is thus more effective to do fewer reps slower vs. more reps at a normal speed if your goal is to "grow" muscle.
  • Vitamin D affects muscle recovery directly (Owen. 2015) -- We already know that vitamin D figures in one way or another in (a) the adaptive response to exercise and (b) the recovery process after strenuous workouts. Unfortunately our "knowledge" is based mostly on correlations and associations and can thus hardly be considered reliable evidence. That's something researchers from the Liverpool John Moores University, the Charité in Berlin, the Norwich Medical School and other European labs weren't happy with, either. Accordingly, they designed a randomised, placebo-controlled trial that involved twenty males with low serum 25[OH]D (45 ± 25 nmol.L-1) who performed 20×10 damaging eccentric contractions of the knee extensors with peak torque measured over the following 7 days of recovery prior to and following 6-weeks of supplemental Vitamin D3 (4,000 IU.day-1) or placebo (50 mg cellulose).

    To complement the results of this human trial, the authors conducted a parallel experimentation using isolated human skeletal muscle derived myoblast cells from biopsies of 14 males with insufficient serum 25[OH]D (37 ± 11 nmol.L-1) that were subjected to mechanical wound injury. Thus, the scientists tried to emulate the process of muscle repair, regeneration and hypertrophy in the presence and absence of 10 nmol or 100 nmol 1α,25[OH]2D3 in the petri dish.
    Figure 2: In view of the fact that the scientists used active vitamin D3 (calcitriol) in the in-vitro study, the improved recovery in the human trial is all the more the more relevant results of the study. It does yet pose the question whether similar or any effects had been observed in subjects with sufficient vitamin D levels in whom the provision of extra vitamin D3 may have increased 25OHD, but not the systemic calcitriol levels of which the scientists' in-vitro dta shows that it is responsible for the effects (Owens. 2015).
    What the results of both studies have in common is that they support the previously claimed role of vitamin D in muscle repair and regeneration. How's that? Well, the supplemental Vitamin D3 the D-ficient human subjects received didn't just increase the serum 25[OH]D levels. It also lead to measurable improvements of the recovery of peak torque at 48 hours and 7 days post-exercise. In conjunction with the observation that 10 nmol 1α,25[OH]2D3 aka calcitriol (=active vitamin D3, not the supplement you consume) improved muscle cell migration dynamics and resulted in improved myotube fusion/differentiation at the biochemical, morphological and molecular level in the cell study, where it also increased the myotube hypertrophy at 7 and 10 days post-damage, these preliminary data do just as the scientists say "characterise a role for Vitamin D in human skeletal muscle regeneration and suggest that maintaining serum 25[OH]D may be beneficial for enhancing reparative processes and potentially for facilitating subsequent hypertrophy" (Owens. 2015).
"Explosive Reps May Pay Off - At Least on the Bench: Fast Reps = Higher Muscle Activity, Higher Volume... Gains?" Find the answer to this question from a previous SuppVersity article here.
So what? Yes and no! Those are the answers to the questions you are probably about to ask. Yes, it does make sense to keep an eye on your vitamin D (25OHD in serum) levels, to do blood tests regularly and to supplement according to your personal needs. Yes, it does also make sense to get 1,000 IU of vitamin D3 per day even if you don't know you're deficient. And yes, all that may actually help you to recover faster.

What neither vitamin D3 nor super-slow training will do, though, is to turn you into a ripped super-muscular freak. In fact, the answer to the rarely asked question whether it makes sense to switch from a regular hypertrophy training regimen with a TUT of 1-0-1 or 2-0-2 to a super-slow regiment, is "no". Or more precisely: No, it is not generally recommendable to do super-slow training instead of regular resistance training if your goal is max. muscle hypertrophy.

A question the study by Herman-Montemayor cannot answer, however, is whether doing super-slow training only least temporarily (as part of a perdiodization scheme, for example) would help pro-athletes to make further or faster progress. Even without a study, though, it can be said that someone who has been training with a TUT of 1-0-1 and weights corresponding to his/her 6-10RM (=80-85% of 1RM) for years and for whom the super-slow training would constitute a novel training stimulus is probably more likely to benefit from intermediate super-slow training than the subjects in the study at hand for whom this was the first 6-week gym experience | Comment on Facebook!
References:
  • Herman-Montemayor, Jennifer R., et al. "Early-phase satellite cell and myonuclear domain adaptations to slow-speed versus traditional resistance training programs." Journal of strength and conditioning research/National Strength & Conditioning Association (2015).
  • Owens, Daniel J., et al. "A Systems Based Investigation into Vitamin D and Skeletal Muscle Repair, Regeneration and Hypertrophy." American Journal of Physiology-Endocrinology and Metabolism (2015): ajpendo-00375.

Many Probiotics Contain Antibiotic Resistant Bacteria. Plus: Number of Live Bacteria is up to 95% Below Label Claims

$
0
0
Probiotics under urgently needed scrutiny - This is the first study to test for antibiotic resistances and to highlight the discrepan- cy between label claims and the actual number of live bacteria in supplements.
There have been plenty of good news about probiotic supplements in the news (including the SuppVersity News), lately. One thing that is often forgotten, though, is that the effect of the supplements depends on (a) the exact type of bacteria that are in the pills, (b) the ratio of the different strains and (c) the number of bacteria that are still alive.

Unfortunately, this important truth is rarely mentioned in the edutainment articles on probiotics in the laypress and sales pitches you will find all over the Internet.

Another thing, even you may not have thought about yet is however the potential occurrence of antibiotic resistances among the bazillions of bacteria in your allegedly healthy probiotic supplements.
You can learn more about the gut & your health at the SuppVersity

Fiber for Female Fat Loss

Sweeteners & Your Gut

Foods, Not Ma- cros for the Gut

Lactulose For Gut & Health

Probiotics Don't Cut Body Fat

Is Gluten Intolerance Real?
A group of people who thought of this hitherto overlooked problem are researchers from the  King Abdullah University of Science and Technology in Saudi Arabia and the UCSI University in Malaysia (Wong. 2015). In their recent paper in the scientific journal Nutrition Journal, the international group of researchers are the first to highlight a previously ignored problem i.e. the possibility that certain genes that make bacteria resistant to antibiotics "could transfer to pathogens sharing the same intestinal habitat" - an event that is, as the scientists rightly point out, "conceivable considering the fact that dietary supplements contain high amounts of often heterogeneous populations of probiotics" and could thus "confer pathogens protection against commonly-used drugs" (Wong. 2015).

MRSA in your probiotic supplements? 

Against that background and in view of the numerous reports of antibiotic resistant probiotics in food and biological sources, the antibiogram of probiotics from dietary supplements remains elusive.
Figure 1: Petri dishes from the antibiotic test (top). If the antibiotics still worked on the bacteria in the probiotics, they all should be dead. As you can see (in the graph, as well), that's by no means the case (Wong. 2015).
In fact, Wong et al. are apparently the first researchers to screen five commercially available dietary supplements (the full names were not disclosed) for resistance towards antibiotics of different classes - with somewhat disconcerting results, namely:
  • Even probiotics that help weight loss, could transfer antibiotic resistances.
    Probiotics of all batches of products were resistant towards vancomycin.
  • Several batches of probiotics from four different brands were also resistant towards streptomycin, aztreonam, gentamycin and / or ciprofloxacin antibiotics (this includes the US and Austrian products, i.e. Cn and Bn, respectively)
  • The fifth brand showed a unique resistance towards gentamycin, strepto- mycin and ciprofloxacin antibiotics. 
Now, as previously pointed out, this does not mean that "bad" bacteria which will always be present in your gut, will automatically acquire the same resistances, but the mere fact that it is possible should tell you that the current hype over probiotics as the "go-to supplement" everyone should take is unwarranted, or at least premature.

You're not getting what you're paying for!

The problem with antibiotic resistances is yet not the only intriguing result of Wang's study. The researchers analyses also revealed that you're not just getting more (albeit unwanted) ingredients that you're paying for, they also found a significant discrepancy between the enumerated viable bacteria amounts and the claims of the manufacturers.
Figure 2: Non-strain specific essay that evaluated the number of live bacteria in the products. The products from producers Bi, Bg, and L didn't just contain significantly less living bacteria than the manufacturers claim, the number is even so low that it is absolutely certain that they are 100% useless. The good news may be that the low dose supplements from the Austria(BN) and USA (CN) contained either more or at least roughly the amount of bacteria on the label (Wong. 2015).
In other words, while the scientists claim that you would get more than enough viable bacteria from their product to have a significant impact on your intestinal microbiome, the reality is that many of the good bacteria are dead before you even open the package.
The "live bacteria"-problem can be solved by eating probiotic foods like yogurt. The problem with potential antibiotic resistances, on the other hand, is rampant with foods, too. Even meat (especially chicken) and allegedly extra-healthy products like veggies from the farmers market may be tainted (the latter due to natural fertilizers of animal origin aka slurry).
Bottom line: The transfer of genes that could make bad gut bugs resistant to antibiotic is only a possibility, but it's one with literally fatal consequences. If bacterial strains in your gut have become resistant to antibiotics and you end up - for whatever reason - with an infection, i.e. a rapid multiplication of these bacteria, you could probably find yourself in the emergency room ... or worse.

In conjunction with the proven lack of viable bacteria in the five products from the US, Malaysia and Austria this study casts a shadow on a class of supplements with rapidly increasing sales - a shadow that becomes even darker if you remember my previous warning that we know literally nothing about the far-reaching interactions between the billion of different bacteria in our gut to even know the "good" from the "bad" guys | Comment on Facebook!
References:
  • Wong, Aloysius, et al. "Detection of antibiotic resistance in probiotics of dietary supplements." Nutrition journal 14.1 (2015): 1-6.

Net Protein Retention and Dietary Protein: When It Comes to Steaks, More Helps More - By Inhibiting Protein Breakdown

$
0
0
Want to maximize net protein retention? Order another one... another steak ;-)
In view of the WHO's recent epidemiological bogus publication, ... ah I mean their review of the epidemiological research that said that "red meat kills", it is quite surprising that the study Il-Young Kim and colleagues conducted in healthy young adults was even approved by the ethics committee of their respective research institutions. After all, the study involved measuring the whole body protein kinetics of young men and women after the consumption of ~40g (moderate protein, or MP) or, even "worse", ~70g (higher protein, HP) of protein in form of red meat (85% lean ground beef) in a regular food matrix (=as part of a normal meal | see Table 1 for an exact overview of the macronutrient content).
You can learn more about protein intake at the SuppVersity

Are You Protein Wheysting?

More Protein ≠ Autom. Fat Loss

More Protein ≠ More Satiety
Protein: Food or Supplement?

Protein Timing DOES Matter!

Too Much Whey Pro-Diabetic?
Whole protein kinetics? Yes, that's different from what you see in the average "whey protein builds muscle study", in which the researchers measure only the fractional protein synthesis. Kim et al. went one step further and measured the protein synthesis (PS), breakdown (PB), and net balance (NB) in their subjects, twenty-three healthy subjects [18 – 40 yrs] who were recruited from the Little Rock area using local newspaper advertisements and flyers posted around the University of Arkansas for Medical Sciences (UAMS) campus and the Little Rock area. Now, it's not like humans had a display you can use to read these variables, so eventually, they were still calculated based on the determinations of the rate of appearance (Ra) into the plasma of phenylalanine and tyrosine, and the fractional Ra of endogenous tyrosine converted from phenylalanine as in a previous study by the same team of researchers (Kim. 2015a). Since this technique is unable to distinguish between the different sites of protein breakdown.and storage, the results of the study at hand could describe increases or decreases in splachnic (=organ) protein synthesis or breakdown, too. It is thus not possible to exclude a null effect on skeletal muscle protein synthesis and breakdown based on the available data.

Whole protein kinetics, two different amounts of protein, with and without exercise

There were yet other things Kim's study had in common with many of the aforementioned "whey protein studies": The study had a run-in that was included to minimize any potential effects of the protein content of the subjects' baseline diets. The subjects ate their high or medium protein meals in the fasted state and the participants - or at least some of them - also trained. To be more specific, the subjects were randomly assigned into an exercise group (X, n=12) protocol consisting of 3 sets of 10 repetitions of bench press, lateralis pull-down, leg press, and leg extension each at 80% of 1 repetition maximum (1 RM, the maximum weight that can be lifted for one repetition) at a pace of 30 sec per set (rest interval between sets was less than 2 min, and the entire exercise bout was completed in ~45 – 50 min), or a resting group (R, n=11).
Table 1: Overview of the macronutrient intake during the 4-day run-in and the actual experiment (Kim. 2015b)
So much for the study design. Let's take a look at the results now: When the scientists analyzed the data from the 7-h stable isotope tracer infusion protocol that was used to determine the rate of protein synthesis (PS), breakdown (PB) and net protein balance (NP), they realized that...
  • exercise did not significantly affect protein kinetics and blood chemistry, while 
  • feeding, in general, resulted in a positive net protein balance at both levels of protein intake,
Boring? You're right. This would hardly be a 'SuppVersity newsworthy' study if the researchers had not also confirmed what most of you probably already suspected: The high protein meal lead to a significantly greater increase in net protein balance than the medium protein meal.
Figure 1: It's the decrease in protein breakdown, not the marginal increase in protein synthesis that makes the difference between the net protein balance after the high and medium protein meals (Kim. 2015b).
Interestingly enough, this increase in net protein balance was achieved primarily through a greater reduction in PB and to a lesser extent stimulation of protein synthesis (for all, p<0.0001). This is an important results, because it suggests that all previously reported ceiling effects for protein synthesis could be irrelevant when we are talking about a potential limit of protein intake beyond which you won't be able to see further beneficial effects on body composition in general and the accrual of lean mas in particular.
Figure 2: The analysis of the inter-group differences in EAAs, glucose and insulin suggest that the difference is meadiated mainly by the increase in serum EAAs and not a "side effect" of increased, highly anticatabolic (Fukagawa. 1985) insulin.
Bottom line: When it comes to interpreting the results, two things are important. Firstly, it is worth mentioning that the previously described decrease in protein breakdown was achieved in response to a greater increase in plasma EAAs (p<0.01) - not in response to increased insulin levels (inter-group differences were non-significant over time). That's important because it means that you wouldn't see the same effect by simply adding more insulinogenic carbs to the meal in order to increase the levels of one of the most powerful inhibitors of protein breakdown: insulin (Fukagawa. 1985)!

Sounds great, right? More helps more! True, there's yet (a) the previously hinted at problem that we can't tell if what the scientists measured was muscle or splachnic protein. Furthermore, the results of the study are (b) valid only if the protein comes from slow-digesting meat. From previous research, I discussed in detail back in 2013, already, we know that the ingestion of similarly high amounts of fast digesting proteins, like whey, does not inhibit, but rather trigger an increase in protein breakdown and gluconeogenesis that uses the ingested protein as a substrate. Now, that doesn't mean that using too much whey protein will cost you muscle mass. What it does mean, though, is that you'll be "Protein Wheysting" if you mistakenly believe that the results of Kim's study apply with a very slow digesting protein source apply turbo-proteins, as well.

So what's the verdict?  Don't economize on protein, but don't fool yourself to believe that with protein more is always always better. Maybe I should also remind you that when you're dieting a high protein intake can yield better results than a very high one and that's a conclusion from a metabolic ward study | Tell me and others what you think on Facebook!
References:
  • Fukagawa, N. K., et al. "Insulin-mediated reduction of whole body protein breakdown. Dose-response effects on leucine metabolism in postabsorptive men." Journal of Clinical Investigation 76.6 (1985): 2306.
  • Kim, Il-Young, et al. "Quantity of dietary protein intake, but not pattern of intake, affects net protein balance primarily through differences in protein synthesis in older adults." American Journal of Physiology-Endocrinology and Metabolism 308.1 (2015): E21-E28.
  • Kim, et al. "The anabolic response to a meal containing different amounts of protein is not limited by the maximal stimulation of protein synthesis in healthy young adults." Am J Physiol Endocrinol Metab (November 3, 2015b). doi:10.1152/ajpendo.00365.2015.

Weight Loss, 'Metabolic Damage' and the Magic of Carbs? Human Study Probes Effects of Carbohydrate Content, GL & GI on Diet-Induced Suppression of Resting Metabolic Rate

$
0
0
Will slimming down from a 120 cm to a 60 cm waist always ruin your metabolic rate and set you up for weight regain or can high GI protect you from yoyoing?
Broscience tells us: "Carb up to preserve your resting metabolic rate." And in fact, there is some scientific evidence that suggests a link between high(er) carbohydrate intakes and increased thyroid function. The same amount of T3 will trigger a sign. higher stimulation of lipolysis and fat oxidation, for example, on high vs. low carb diets (Mariash. 1980). Low carb diets, on the other hand, lead to significant reductions of the active thyroid hormone and increases in the 'thyroid receptor inhibitor' rT3 - even in healthy individuals and if the energy intake is standardizes (Serog. 1982; Ullrich. 1985). So, is broscience right? Well, overfeeding studies show a similar increase in T3 in response to protein, fat and carbohydrates (Danforth Jr. 1979). So refeeds should work, irrespective of their carbohydrate content...
# Women appear to be particularly prone to # metabolic damage - more on # female fat loss:

1g PRO per 2g CHO + Circuit T. for Women?

Is the Optimal Exercise Order Sex-Specific?

1-3mg Melatonin Shed Fat W/Out Diet & Exercise

Not Bulky! Lifting Will Make Toned & Strong.

How to Really Train Like a Woman

Sex-Differences in Fat Oxidation - Reviewed
As you can see, it is hardly possible to confirm or reject the "carb up to prevent metabolic damage" (=prevent the diet induced over-proportional reduction in resting energy expenditure) hypothesis based on the existing evidence. A recent study by J. Philip Karl and colleagues who tried to determine "the effects of diets varying in carbohydrate and glycemic index (GI) on changes in body composition, resting metabolic rate (RMR), and metabolic adaptation during and after weight
loss" (Karl. 2015), however, may yet take us one step further towards rejecting or confirming this commonly heard of idea.
Figure 1: Overview of the key parameters of the study design and dietary composition (Karl. 2015).
In said study, Karl et al. randomly assigned adults with obesity (n = 91) to one of four diet groups for 17 weeks. As you can see in Figure 1, the diets all subjects were provided with differed in percentage energy from carbohydrate (55% or 70% | Figure 1, top-right) and GI (low or high, Figure 1, bottom-right) but were matched for protein, fiber, and energy. The study design itself comprised 5 phases:
Metabolic Damage in Biggest Losers: Will Diet & Intense Exercise Make You Fat, While Surgery Will Make You Lean? Plus: How to Avoid or Even Correct Diet-Induced REE Reductions | more
"Phase 1 was a 5-week weight maintenance phase in which weight maintenance energy needs were determined by adjusting provided energy intake to maintain stable weight. Mean Phase 1 energy intake was 12.2 MJ/day with 48% energy provided as carbohydrate, 16% as protein, and 36% as fat. Following Phase 1, participants were randomized by the study statistician to their Phase 2 dietary assignment using computer-generated randomization. The four diets differed in carbohydrate content (55%, ModCarb or 70%, HighCarb of total energy) and dietary GI (less than 60, LowGI or 80, HighGI), and were provided for 12 weeks at 67% of the weight maintenance energy intake determined in Phase 1. 
Participants were allowed to increase their energy intake during Phase 2 by requesting additional, randomization-appropriate foods from the metabolic kitchen if too hungry to be adherent. Phase 3 was a 5-week weight maintenance phase during which food was provided according to randomization. Energy intake during Phase 3 was prescribed to support weight maintenance at the new, lower body weight, and was predicted from body weight and energy intake measured at the end of Phase 2, with adjustment for self-reported physical activity. Phase 4 was a 12- month follow-up period during which participants selected and pre pared their own meals after being provided with instructions on fol lowing the diet to which they were randomized" (Karl. 2015)
To assess the effects of this sequence of induction (weight maintenance), and weight stabilization phases, the body weight, body composition, RMR, and metabolic adaptation (measured RMR vs. predicted resting metabolic rate = RMR) of the middle aged study participants (49-64 years) were measured before and after all phases of the study.
Figure 2: (A) Weight loss and (B) percentage of total weight loss attributable to fat mass and fat free mass while consuming provided-food diets differing in glycemic index (GI) and percent energy from carbohydrate (55%, ModCarb and 70%, HighCarb) for 17 weeks (n = 79). Values are mean 6 SEM. Weight loss analyzed by repeated measures ANCOVA, body composition by two-factor ANOVA. a,bMain effect of time; asignificant decrease from baseline (P < 0.001), bsignificant difference from Phase 2 end (P < 0.001). No diet effects (main effects or interactions) for any comparisons. GI, glycemic index; HighCarb, 70% energy from carbohydrate; ModCarb, 55% energy from carbohydrate (Karl. 2015).
Interestingly, the analysis of this data revealed no significant inter-group differences in terms of any of the relevant study outcomes. Yes, you read me right: This means that neither the GI, nor the GL, nor the carbohydrate content of the diet had statistically significant effects on weight loss, body composition, RMR, or the metabolic adaptation aka "metabolic damage" due to weight loss.
Figure 3: Measured resting metabolic rate as a function of predicted metabolic rate (Karl. 2015). Note: If there was no "metabolic damage", the solid line which represents the ideal body-weight dependent decline of energy expenditure and the dashed line which represents the actual ratio of the measured to the predicted RMR should be congruent.
While there were no inter-group differences and neither the amount or the type of carbohydrates had an effect on the reduction of the metabolic rate, there is still one interesting result you can see in the right graph in Figure 3. Said graph depicts the ratio of the measured to the predicted metabolic rate during the 5-week weight maintenance phase. If you look closely, you will realize that it suggests that having a high predicted RMR, i.e. being heavier, being taller and being more muscular, is associated with a non-significant decline of the non-predicted reduction of the energy expenditure (=metabolic damage) and thus a narrowing of the gap between the solid and dashed line.

"Solid and dashed? I don't get it!"

You're asking how I can support this hypothesis? Well, the dashed line that represents the true ratio of the actual to the predicted RMR approaches the theoretical one (the solid line) for higher RMR values. If this was more than a trend, it would suggest that two things: (a) Losing less weight and thus maintaining a higher predicted metabolic rate protects against metabolic damage (that would be useless). And (b) being tall and muscular and thus having a naturally high(er) predicted RMR can protect you from suffering metabolic damage when you lose weight.

Unfortunately, it's not possible to tell which (if any) of the two options is correct. If I had to make an educated guess, though, I would say it's a combination of both: The weight change of an average 5.5 kg did not wary too much and was withing 95% confidence intervals of [-7.1 kg, -4.6 kg]. In conjunction with individual physiological qualities of people with higher baseline RMRs, it could still explain the narrowing of the gap between predicted and true RMR after dieting.
Figure 4: Changes in body composition (absolute value in kg) after 20 weeks and after weight loss phase 2 (Karl. 2015).
Bottom line: As Karl et al. point out, "neither low-GI relative to high-GI diets nor moderate-carbohydrate relative to high-carbohydrate diets showed differences with respect to effects on changes in body composition or resting metabolism during weight loss when confounding dietary factors were tightly controlled in a study providing all food for 22 weeks" (Karl. 2015).

This does not just go against the mainstream assumption that low GI and/or low(er) carbohydrate diets facilitate weight loss, fat loss and weight maintenance (see data in Figure 4 for an overview of these parameters, it also contradicts the initially mentioned broscientific assumption that carbohydrates, in general, and high GI carbs, in particular, have a protective effect against the unexpected diet-induced reduction of basal energy expenditure many people know as "metabolic damage". If there's anything of which the study at hand suggests that it could protect you from such unexpectedly large decrease in RMR, it's not high GI carby, but rather an already high(er) baseline RMR (see Figure 3).

And what does that tell us? Right! Since a high predicted RMR is a function of (a) being male, (b) being tall, and (c) being muscular, all three attributes may protect you from diet-induced "metabolic damage" | Let me know your thoughts and comment on Facebook!
References:
  • Danforth Jr, Elliot, et al. "Dietary-induced alterations in thyroid hormone metabolism during overnutrition." Journal of Clinical Investigation 64.5 (1979): 1336.
  • Karl, J. Philip, et al. "Effects of carbohydrate quantity and glycemic index on resting metabolic rate and body composition during weight loss." Obesity 23.11 (2015): 2190-2198.
  • Mariash, C. N., et al. "Synergism of thyroid hormone and high carbohydrate diet in the induction of lipogenic enzymes in the rat. Mechanisms and implications." Journal of Clinical Investigation 65.5 (1980): 1126.
  • Serog, P., et al. "Effects of slimming and composition of diets on VO2 and thyroid hormones in healthy subjects." The American journal of clinical nutrition 35.1 (1982): 24-35.
  • Ullrich, Irma H., Philip J. Peters, and M. J. Albrink. "Effect of low-carbohydrate diets high in either fat or protein on thyroid function, plasma insulin, glucose, and triglycerides in healthy young adults." Journal of the American College of Nutrition 4.4 (1985): 451-459.

Nine Short Workouts (AM+PM) p. Week Yield Extra Strength, Size and Performance Gains Compared to Volume Matched 3-Day Split, All Differences are Non-Significant, Though

$
0
0
15 min in the AM, 15 in the PM = Win? For many of you that may sound laughable, but according to a recent study from the University of Copenhagen it is at least as effective as three "mammoth" workouts-sessions per week.
What kind of trainee are you? Do you hit the gym thrice a week, spend two hours there and crawl out of the gymdoors totally exhausted? Yeah... Well that means you're not the fitness model guy, who trains twice a day for 15-20 minutes only and swears that this is the only way to do it?

After all these questions you're probably asking yourself if the answers you gave in your mind were good or bad for ya? Right? Well, eventually, both forms of training can be equally effective. If we take a closer look at the non-significant study outcomes in a recent paper by scientists from the University of Copenhagen (Kilen. 2015), though body composition and strength may in fact benefit more if you train more frequently - even if the total workout volume is the same.
No single workout routine works forever. Periodize to make continuous progress!

30% More on the Big Three: Squat, DL, BP!

Block Periodization Done Right

Linear vs. Undulating Periodizationt

12% Body Fat in 12 Weeks W/ Periodizatoin

Detraining + Periodization - How to?

Tapering 101 - Learn How It's Done!
Workout volume? Yes, that's the number of sets and reps. So, let's say you do three 45-minute training sessions weekly, including 1 strength on Monday, 1 high intensity cardiovascular (HIIT) session on Wednesday, and 1 muscle endurance session on Thursday, then those 3x45 minutes + warm-up exercise are your total workout volume.

In case that's what you're doing on a regular basis, you're training just like those of the 21 study subjects (10 men, 11 women; 25 +/- 3 years) with some previous training experience who were randomly assigned to the "classical" training program in the previously mentioned study by Kilen, et al. (2015). If you're rather the fitness model type, you may recognize your own training in what the other subjects did, i.e. a "micro training" program with a total of nine 15-minute training sessions weekly that were divided equally between strength training, high-intensity cardiovascular training, and muscle endurance training and performed in the AM and PM from Monday to Friday (there was no PM training on Friday, though, and cardio and strength were rotated | see caption of Table 1).
Table 1: Description of the two different training regimen (Kilen. 2015) | *To minimize the potential negative effect of concurrent cardio + strength training, MI performed 2 days of strength (Mon and + Tue) and 1 day of cardio training (Wed) in odd weeks, and 1 day of strength (Mon) and 2 days of cardio training (Tue + Wed) in even weeks.
Unlike the training frequency and rest between workouts, the strength training, HIIT and muscular endurance training sessions, themselves, were identical in both groups:
  • Strength training consisted of leg exercises (deadlifts, lunges, step-ups, and 1 leg squats), with 1–2 warm-up sets and 2–3 target sets of 8RM, and upper-body exercises (pullups, dips, weighted push-ups, and 1 arm rows), with 1–2 warm-up sets and 2–3 target sets of 5RM. For progression, the exercises were adjusted using extra loading (sandbags in 1-kg steps) if the subjects were able to accomplish more repetitions than prescribed. If the subjects were not able to perform the number of repetitions prescribed, they performed as many as they could in proper form and finished the set conducting only the eccentric phase of the exercise. 
  • High-intensity cardiovascular training (HIIT) consisted of running for 2 and 4 minutes at an average speed of 15.1 and 14.5 km/h, respectively, which elicited ;90% maximal heart rate during exercise. Micro training performed two 4-minute run intervals in the morning with 3 minutes of rest in between and four 2-minute run intervals in the afternoon with 1 minute of rest in between. Classical training performed three 4-minute and six 2-minute run intervals in the same training session with the same rest as MI in between. The training volume was evaluated and the only significant difference was running distance during 2-minute and 4-minute intervals, where MI ran significantly further than CL in each interval. 
  • Muscle endurance training consisted of three 5-minute exercise sessions involving 5 different exercises performed continuously for 30 seconds with 30-second rest periods. Micro training conducted 3 sessions; the first was “easy,” the second “hard,” and the third “very hard.” Classical training conducted 9 sessions in the same order, starting over with “easy” on the fourth and seventh sessions. The exercises were weighted lunges (with a 20-kg sandbag); push-ups; shuttle runs; abdominal exercises ([a] regular sit-ups from a supine position with knees bent at 908, fists in contact with the ears and the lumbar arch supported by a folded towel, and [b] diagonal sit-ups from a horizontal supine position, outstretched hand to opposite raised foot, alternating); and back exercises ([a] back extensions on an incline bench and [b] kettlebell swings in a standing position). 
As Kilen et al. point out, "[a]ll training sessions were supervised by scientific staff, and subject attendance" as well as "[h]eart rate [...] during high-intensity cardiovascular training and muscle endurance training for the last 5 weeks of the training intervention" (Kilen. 2015) were recorded.
Figure 1: Relative pre- vs. post changes in all measures performance markers (calculated based on Kilen. 2015).
After the 8-weeks on the respective training regiment, a comparison of the pre- vs. post-training data yielded the following results:
  • Increases in shuttle run performance were observed in both group, albeit with a higher significance as far as the pre- vs. post-difference is concerned in the classical training (CL) vs. micro training (MI) group (MI: 1,373 +/- 133 m vs. 1,498 +/- 126 m, p < 0.05; CL: 1,074 6 213 m vs. 1,451 6 202 m, p , 0.001).
  • Significant improvements in peak oxygen uptake (3,744 6 +/- 615 mL/min vs. 3,963 +/- 753 mL/min | p < 0.05), maximal voluntary isometric (MVC) force of the knee extensors (646 +/- 135 N vs. 659 +/- 209 N | p < 0.001), MVC of the finger flexors (408 +/- 109 N vs. 441 +/- 131 N, p < 0.05), and the maximal number of lunges performed in 2 minutes (65 +/- 3 vs. 73 +/- 2, p , 0.001), however, were seen only in the micro = high frequency training group.
The question you may be asking yourselves now is: Why does the headline say that there were no significant differences? Well, the lack of statistical significance of the improvements in the classical training group does not suffice for a statistically significant between difference to the micro training group. Statistical significant inter-group differences did not exist either before or after the study. The scientists conclusion that
"similar training adaptations can be obtained with short, frequent exercise sessions or longer, less frequent sessions where the total volume of weekly training performed is the same" (Kilen. 2015)
is thus absolutely correct. The fact that statistical significance for the aforementioned study outcomes was achieved in the micro, yet not in the classical training group does still suggest that the high(er) frequency training regimen may have an adaptive edge... albeit in terms of study outcomes not everyone will deem practically relevant.
Figure 2: Neither the in-group nor the inter-group changes in body composition did reach statistical significance (calculated base on Kilen. 2015). At least in my humble opinion, though, they are still interesting.
Speaking of what people will deem relevant: We haven't addressed the changes in body composition yet. Why's that? Well, if we go by statistical significance, there were none. If we go by %-ages, though, the increase in lean and decrease in fat mass in the micro training, as well as the opposite trends in the classical training group add to the non-significant evidence that it may make sense to train more frequent and that - when all is said and done - total volume may eventually not be the only thing that matters... I mean, if you look at the data in Figure 2 it would - in defiance of the statistical insignificance of the changes - still seem as if the previously mentioned fitness model was right: For him or her, for whom improves body composition are the primary goal, his / her frequent AM/PM training regimen does in fact appear to be the training model of choice | Comment!
References:
  • Kilen, Anders, et al. "Adaptations to Short, Frequent Sessions of Endurance and Strength Training Are Similar to Longer, Less Frequent Exercise Sessions When the Total Volume Is the Same." The Journal of Strength & Conditioning Research 29 (2015): S46-S51.

Health & Weight Loss Start in the Gut: Probiotics Trigger Fat Loss Without Dieting | Casein Improves Lipid Metabolism

$
0
0
Gut health is "all the rage", lately. So even if it's true that this may be one of the most culpably neglected areas of research in the past century, we should still be careful not to hype the effect of the gut on your physique and health too much.
Well, probiotics and the human microbiome (the one in the gut and elsewhere) are all the rage, these days. Against that background, it's not really surprising that a probiotic supplement and thus a human microbiome modulator made it into the SuppVersity news (again). What may be surprising, though, is the fact that casein didn't just do the same, but that its appearance here in the news is not due to its muscle building prowess. Rather than that, casein made the cut, because a recent study by Francois Mariotti, et al. shows that - even in comparison to whey protein - casein attenuates the potentially unhealthy postprandial triglyceride response to a mixed high-fat meal in healthy, overweight men.
You can learn more about the gut & your health at the SuppVersity

Fiber for Female Fat Loss

Sweeteners & Your Gut

Foods, Not Ma- cros for the Gut

Lactulose For Gut & Health

Probiotics Don't Cut Body Fat

Is Gluten Intolerance Real?
  • Cheesy! Casein keeps your trigs in check - Due to the interaction between elevated postprandial triglyceride levels, insulin resistance and cardiovascular disease, the results of the previously mentioned study by Mariotti et al. (2015) may be of interest not just for all of us. After all, the proposed mechanism of which the authors, scientists from the AgroParisTech speculate that it is a direct result of the same
    "solubility of casein and its precipitation that forms a gel in the stomach [which have long been] known to influence its rate of absorption and postprandial protein metabolism in the context of regular, low-energy meals" (Mariotti. 2015),
    as the marked effect on the chylomicron kinetics and decrease in postprandial TGs, a risk factor for cardiovascular disease, the French scientists observed in the study at hand.
    Figure 1: Area under the curve for triglycerides (did respond), amino acids (didn't respond) and glucose (didn't respond) in 10 overweight subjects after consuming isocaloric high-energy meals with 15% of the energy from protein in form of casein (CAS), whey protein (WHE) or alpha-lactalbumin enriched whey (LAC | Mariotti. 2015)
    As you can see in Figure 1, the proteins which made up exactly 15% of the total energy content of the high-fat meal that was fed to 10 healthy overweight men with an elevated waist circumference (>94 cm) did not affect the subjects' postprandial plasma glucose, amino acids, insulin, or nonesterified fatty acid levels (which would, by the way, suggest that ingesting whey or an alpha-lactalbumin enriched whey protein with a meal ruins its amino acid absorption advantage). The study outcome that did differ, though were the postprandial triglycerides (TGs) levels, where the provision of casein lead to a highly significant 22% (+/- 10%) reduction in the 6-h area under the curve.
And I thought casein was bad for the heart? Well, there are in fact concerns that certain forms of casein - more specifically, beta-casein A1 - could be associated with ishaemic heart disease (McLachlan. 2001; Laugesen. 2003). Experimental evidence from humans that would confirm what epidemiologists suggests is yet lacking and the corresponding research happens to be pimped by New Zealand who have the lowest number of A1 cows in their herds | learn more.
  • As the authors point out, similar trends were shown for plasma chylomicrons [apolipoprotein (apo)B-48; P < 0.05], yet not for the postprandial oxidative stress (plasma hydroperoxides and malondialdehyde), endothelial dysfunction (salbutamol-induced changes in pulse contour analysis), or low-grade inflammation. This is also why it is as of yet only a logical, but hitherto unsupported hypothesis that consuming casein (micellar casein, not regular sodium or calcium caseinates) would also reduce one's cardiovascular disease risk. Eventually, it does yet appear to be the more reasonable adjunct to a full meal anyway - the purpose of the latter is after all to keep you satiated for a long time; and that's where casein is unquestionably a better choice than whey.
  • Probiotics - 0.5% body fat reduction, and a 2.68 cm² reduction in subcutaneous fat area are not much, but they occurred in the absence of diet and exercise - If the trend continued and the 120 nondiabetic and overweight subjects Jung et al. divided into two groups: There was the probiotic group with 60 individuals who consumed 2 g of powder of two probiotic strains, L. curvatus HY7601 and L. plantarum KY1032, each at 2.5 × 10⁹ cfu, twice a day. And there was the and a placebo group, likewise 60 individuals, who consumed the same amount of powder that did not contain any probiotics.
    Figure 2: Changes in body composition according to waist measurement and CT scans - All values are relative changes in waist and fat area measure from week 0 to week 12 (Jung. 2015).
    Both groups were advised to take their supplements immediately after breakfast and dinner, but only the probiotic group saw relevant improvements in body fat at slow) pace - albeit a pace at which it would take them "only" 5 years to finally make it into healthy body fat zones.
Probiotics under urgently needed scrutiny: Many Probiotics Contain Antibiotic Resistant Bacteria. Plus: Number of Live Bacteria is up to 95% Below Label Claims | Learn more.
Prebiotic supplements are not created equal! You may remember my recent article on (a) antibiotic resistances in supplemental probiotics and (b) the lack of viable bacteria in the different supplements the researchers analyzed. It should be obvious that these results mean that even though the study at hand appears to suggest that everyone should take probiotics, further research is needed before we can say which of the many pills on the market this should be... ah, and by the way. It is still not clear whether the same bacteria that are benefical for the obese are anywhere close to beneficial for lean athletic individuals. Rather than general recommendations, I expect the future of probiotic supple-ments to be individual (based on diet and metabolic data).
  • Ok, that's painfully slow, but given the fact that the food intake of both groups didn't differ significantly, it is still noteworthy that the 2 g of probiotic powder which contained contained 0.1 g of L. curvatus HY7601, 0.1 g of L. plantarum KY1032, 1.24 g of crystalline cellulose, 0.5 g of lactose, and 0.06 g of blueberry-flavouring agent made the subjects lose significant amounts of body fat, while their peers who received 2 g of a placebo powder that contained 1.34 g of crystalline cellulose, 0.6 g of lactose, and 0.06 g of blueberry-flavouring agent kept gaining.
    Figure 3: The provision of the probiotic supplement did also trigger significant improvements in the above markers of cardiovascular disease risk - if it's not the small fat loss, it would thus be the potential CVD risk reduction that makes the use of probiotic supplements attractive especially for overweight individuals (Jung. 2015).
    In conjunction with the likewise statistically significant beneficial effects on health markers like LDL oxidation and LDL particle size which indicate significant improvements in cardiovascular disease risk, this is still the first non-sponsored study (the study was financed by Korean Ministry of Science) that shows that supplementing with commercially available probiotics in man may actually produce health-relevant beneficial effects.
Probiotics aren't for the overweight and obese, only. A recently discussed study, for example, showed that a patented multi-strain probiotic will reduce the fat gain on a 4-week "bulk" by more than 50% - and that's in twenty young men who consumed an extra 1,000kcal per day | more.
You are kidding me, right? No, I am not. I know that neither casein nor probiotics appear to be game-changers, but eventually you will have to understand that the one trick, supplement or modification of your lifestyle cannot correct the 10,000 mistakes you have or even are still making. Losing fat and getting healthy is about taking one baby step at a time; and the studies by Mariotti et al. and Jung et al. describe two promising ways of taking another of these steps.

In that it would be great if we knew for sure how both of them work on a mechanistic (molecular) level. As of now, the only thing that appears to be certain, though, is that they act at the level of the gut. One by affecting the digestive process, the other by modifying the make-up of the intestinal microbiome of which more and more studies appear to suggest that it may not be triggering, but at least perpetuating the ill health effects of obesity | Comment!
References:
  • Jung, Saem, et al. "Supplementation with two probiotic strains, Lactobacillus curvatus HY7601 and Lactobacillus plantarum KY1032, reduced body adiposity and Lp-PLA 2 activity in overweight subjects." Journal of Functional Foods 19 (2015): 744-752.
  • Laugesen, Murray, and R. B. Elliott. "Ischaemic heart disease, Type 1 diabetes, and cow milk A1 β-casein." (2003).
  • Mariotti, François, et al. "Casein Compared with Whey Proteins Affects the Organization of Dietary Fat during Digestion and Attenuates the Postprandial Triglyceride Response to a Mixed High-Fat Meal in Healthy, Overweight Men." The Journal of nutrition (2015): jn216812.
  • McLachlan, C. N. S. "β-Casein A 1, ischaemic heart disease mortality, and other illnesses." Medical Hypotheses 56.2 (2001): 262-272.

World Diabetes Day: Is Bariatric Surgery the Only Tool to Send T2DM into Remission? Adherence to 6 Months of Daily Exercise and Eating 500kcal/day Less Works, Too!

$
0
0
Diabetes is a disease that is currently often only managed, not treated and that despite the fact that scientists know ways to send T2DM it into remission.
With the 14th of November being the World Diabetes Day, I thought it may be worth taking a look at the available evidence on treating, not just managing diabetes. If you do just that, there is one treatment that sticks out: Bariatric surgery.

There is currently little doubt that weight loss surgery is the most promising tool doctors have to actually "treat" type II diabetes. As Esposito et al. point out in their recent review of the literature,  "more information is [however] needed about the long-term durability of comorbidity control and complications after bariatric procedures" (Esposito. 2015).
Educate yourself @ www.suppversity.com do battle or avoid T2DM

Pasta "Al Dente" = Anti-Diabetic

Vinegar & Gums for Weight Loss

Nutrient Deficien- cies in the US

Yohimbine Burns Stubborn Fat

You Can Wash Pesticides Away

Milk = Poisonous Hormone Cocktail
Why's that? Well, while the review which comprised three randomized controlled trials and one prospective study that compared the effect of Roux-en-Y gastric bypass (RYGB) procedure against optimal medical therapy, shows that the percentage of diabetic patients in remission (hemoglobin A1C < 6–6.5 % without medications) ranged from 38 to 75 % at the end of follow-up, the large inter-individual differences and the fact that the same review also says that
"[i]ntensive lifestyle intervention is also superior to conventional treatment for inducing remission of type 2 diabetes, with remission rates of type 2 diabetes between 10 and 15 % at 1 year of follow-up" (Esposito. 2015), 
it appears to me as if it was more than worthwhile to highlight that (a) surgery is not the only tool and (b) it is not a reliable method to help people regain control over their health. In fact, it is not the surgery but what happens afterwards that determines ultimate success and here, studies show the same factors to determine between failure and success that would make weight loss surgery obsolete for many non-extremely-obese type II diabetics in the first place. Which factors that would be? Here is a selection that was compiled by Elfhag and Rössner in 2005, already:
Table 1: Factors associated with weight loss maintenance and weight regain after intentional weight loss according to a literature review (Elfhag & Rössner. 2005)
You're seeing patterns you don't observe (left hand) or do observe (right hand side of Table 1) in your type II diabetic uncle or aunt? Well that's certainly no coincidence. The results Elfhag & Rössner published published in 2003 have been repeatedly confirmed.

Figure 1: If you look at the relatively low number of subjects who weren't able to maintain at least 50% of their weight loss, it should become obvious that at least within the first year RYGB surgery is not as black as it is painted by some critics (Cooper. 2015).
Nevertheless, more recent research such as a 2009 study by Odom et al. are useful because they (a) quantify known risk factors and add new ones:

  • Food urges is associated with a 5.1x increased risk of weight regain.
  • Not feeling that the surgery has improved ones life is linked to a 21.5x increased risk.
  • Alcohol or drug use is associated with a 12.74x increased risk.
Against those figures, the 6% reduced risk of significant weight gain  in those with lower scores on a test for depression Odom et al. observed in their analysis of the data appears to be of surprisingly minor practical significance.
After sign. weight loss beta-cells can be "resurrected". Meaning they will undergo a process of apoptosis, death and regeneration (Su. 2015).
But isn't the damage already done? While the damage is done, recent research clearly indicates that once the excess weight and with it the chronic hyperglycaemia, hyperlipidaemia and/or cytokines are gone, the damaged beta-cells "undergo the process of rebirth, which involves apoptosis evasion, regeneration and improved beta-cell function" (Su. 2015). While Su et al. point out that the research is not far enough to copy the effects with a drug, it is yet far enough to say that weight loss surgery works and that's what matters, no?
Self monitoring, on the other hand, doesn't only cut the risk of significant weight gain by 46% and is thus practically relevant, it is also in line with the notion of "being willing and able to do what it takes" that emerges from is the gist of the items on the list Elfhag & Rössner compiled back in 2005.

So what does it take, then?

Self-monitoring is yet only one of the points on the "it takes all this"-list you would have to hand somebody who wants to send his type II diabetes into remission. The be-all and end-all for >90% of the type II diabetics is - even if you are constantly bombarded with opposing messages - the induction of a negative energy balance of which studies Malandrucco et al., who put 14 severely obese type II diabetics on  very low calorie diet (400kcal /day), show improvements in beta cell function after only 7 days! These are experimental results epidemiologists with their "people are not eating too much and moving too little, there must be another reason we are fat"-bogus will have a hard time to debate.
Figure 2: The amount of overweight lost is the only significant predictor of remission of remission of type 2 diabetes mellitus (T2DM) after gastric bypass in a cohort of 177 patients with T2DM who had undergone Roux-en-Y gastric bypass from 1993 to 2003 had 5-year follow-up data available (Chikunguwo. 2010).
I won't negate that there are corollary effects such as changes in satiety hormone production, the new found ability to exercise (let's be honest, with lean and muscular 150lbs it's cheap to say that someone who weighs 500lbs is just too lazy to work out - at that weight he, let alone she, is simply unable to work out!), the motivation that comes with the first visible results and so on and so forth. When all is said and done, though, studies show that "[w]eight regain [is the only] statistically significant, but weak predictor, of T2DM recurrence" after weight loss surgery (Chikunguwo. 2010).
There's more than just one study showing that lifestyle changes alone can reverse type II diabetes! Partial or complete remission of diabetes, defined as transition from meeting diabetes criteria to a prediabetes or nondiabetic level of glycemia (fasting plasma glucose <126 mg/dL and hemoglobin A1c <6.5% with no antihyperglycemic medication) can be achieved only, though, if the intervention triggers significant weight loss and improvements in fitness levels. That's what a 2012 review in JAMA shows. With the -7.9% extra weight loss and the +6.4% extra increase in fitness, subjects who participated in intense lifestyle interventions were 6x more likely to achieve remission than those who participated in the typical "you should eat more healthy and do some cardio"-bogus studies. With a remission rate of 11.5% in the first and 7.3% after four years, Gregg's review does yet support the previously highlighted need of determination and consistency.
In the previously cited study by Chikunguwo, for example the subjects who achieved diabetes remission had lost on average 70% of their excess weight. Those who failed to normalize their blood glucose management, still hat ~50% of their overweight on their hips. That long-term success is determined by weight loss, not the often cited changes in satiety hormone production that occur in response to the surgery is also supported by several reviewers. Gumps et al. (2005) for example state that
  1. "Metabolic damage" may make it harder, but not impossible for "reduced obese" individuals to stay lean | learn more
    All forms of weight loss surgery lead to caloric restriction, weight loss, decrease in fat mass and improvement in T2DM. 
  2. Improvements in glucose metabolism and insulin resistance following bariatric surgery result in the short-term from decreased stimulation of the entero-insular axis by decreased caloric intake. 
  3. In the long-term by decreased fat mass and resulting changes in release of adipocytokines. 
It should and that's the logical and scientifically confirmed conclusion one can draw based on the previously presented facts, thus be possible to see the same beneficial effects that have been observed in many after weight loss surgery in the selected few who manage to lose their weight by "simply" turning their lifestyles' upside down.

Only recently, Philip A. Ades and colleagues from the University of Vermont Medical Center reported in a paper in the Journal of Cardiopulmonary Rehabilitation & Prevention that partial remission of type II diabetes can be achieved within only 6 months if the subjects were willing to participate in a formal lifestyle program that helped them to lose 7.3kg of fat mass (9.7kg total weight loss | see Figure 3 in the bottom-line). The cornerstones of this program, however, won't make every type II diabetic happy. It didn't just involve a 500kcal/day deficit, but also an "almost daily" exercise program consisting of "high-caloric expenditure exercise," with 1 to 3, 45- to 60-minute sessions per week of supervised on-site exercise and home walking on other days for a total of 5 to 6 days per week of exercise.
Figure 3: If a given life-style intervention facilitates high enough rates of fat loss, remission to tolerable HbA1c levels (see dashed line in small graph) occurs in more than half of the subjects (Ades. 2015).
Type II diabetes is treatable! That's the good news. The bad news is that the only treatment that doesn't require the same efforts people were not willing to go through in the years over which they acquired one extra-pound of body fat after the other is bariatric surgery. And even here, only those who are really willing to make a change have a good chance of reversing type II diabetes.

An alternative, in form of an intense diet + exercise lifestyle intervention exists; and while it may take longer to work, remission rates should border zero for all of those who understand that they cannot return to their previous diet and activity levels. Now I will leave it up to you to decide whether that's a good or bad news on "World Diabetes Day" | Let me and others know what you think and comment!
References:
  • Ades, Philip A., et al. "Remission of recently diagnosed type 2 diabetes mellitus with weight loss and exercise." Journal of cardiopulmonary rehabilitation and prevention 35.3 (2015): 193-197.
  • Chikunguwo, Silas M., et al. "Analysis of factors associated with durable remission of diabetes after Roux-en-Y gastric bypass." Surgery for Obesity and Related Diseases 6.3 (2010): 254-259.
  • Cooper, Timothy C., et al. "Trends in weight regain following roux-en-Y gastric bypass (RYGB) bariatric surgery." Obesity surgery (2015): 1-8.
  • Elfhag, K., and S. Rössner. "Who succeeds in maintaining weight loss? A conceptual review of factors associated with weight loss maintenance and weight regain." Obesity reviews 6.1 (2005): 67-85.
  • Esposito, Katherine, et al. "Remission of type 2 diabetes: is bariatric surgery ready for prime time?." Endocrine 48.2 (2015): 417-421.
  • Gregg, Edward W., et al. "Association of an intensive lifestyle intervention with remission of type 2 diabetes." Jama 308.23 (2012): 2489-2496.
  • Gumbs, Andrew A., Irvin M. Modlin, and Garth H. Ballantyne. "Changes in insulin resistance following bariatric surgery: role of caloric restriction and weight loss." Obesity surgery 15.4 (2005): 462-473.
  • Malandrucco, Ilaria, et al. "Very-low-calorie diet: a quick therapeutic tool to improve β cell function in morbidly obese patients with type 2 diabetes." The American journal of clinical nutrition 95.3 (2012): 609-613.
  • Su, Yinjie, Yanling Zhao, and Chaojun Zhang. "Bariatric surgery: beta cells in type 2 diabetes remission." Diabetes/metabolism research and reviews (2015).

GABA Supplementation Improves Glucose Management - Even in Healthy Subjects | Significant Reduction in Glycated Albumin Levels After Only 7 Days on 3x2g GABA per Day

$
0
0
No acute changes in blood glucose, but extreme changes in insulin levels. How can this trigger a reduction in glycated albumin - How's that possible? 
You've read about gamma aminobutyric acid (GABA) at the SuppVersity before. While most people think of it mainly as a calming agent, though, SuppVersity readers know that it has the remarkable ability to heal the insulin producing β-cell in rodents by stimulating their replication, protecting them against apoptosis, and attenuating insulitis (Soltani. 2011; Tian. 2013; Prud'homme. 2014; Purwana. 2014). And while these favorable effects were first observed in mice, researchers are quite sure that they are valid in humans, too- that's also because said effects have been confirmed only recently by Tian et al. (2014) and Purwana et al. (2014) in vitro as well as in xenotransplanted human islets.
Learn more about the effects of GABA & co at the SuppVersity

GABA Diabesity Treatment

Phenibut Addic- tive or Harmless?
All About GABA at SHR

Melatonin = Easy Fat Loss?

Letrozole? Use Melatonin Instead

Bone & Tooth? Melatonin Helps
If you know that, the observations researchers from the Fudan University in Shanghai report in their latest study probably won't come as a surprise. In their investigation into the  pharmacokinetics and pharmacodynamics of GABA in healthy volunteers, the researchers found that the chronic provision of 2g of GABA three times per day triggers a highly significant decrease in glycated albumin (GA) levels, the intermediate measure of blood glucose control (in-between acute blood glucose measurements and HbA1c | Roohk. 2008), within only 7 days.
Figure 1: Acute glucose (top) and insulin (bottom) response after single and repeated administration of 2g of GABA (left). Chronic effects of repeated dose-administration of GABA on glycated albumin (right | Li. 2015).
If you scrutinize the data in Figure 1, though, there are a few questions we still need to find answers to. Obviously, the acute administration of GABA (Figure 1, left) lead to significant increases in insulin - both, under either fasting (1.6-fold, single dose; 2.0-fold, repeated dose; p < 0.01) or fed conditions (1.4-fold, single dose; 1.6-fold, repeated dose; p < 0.01).
Glucose, insulin and glucagon: Let's briefly recap how the three are related. To lower your glucose levels, your body produces insulin which will then tell your cells suck the glucose from the bloodstream. If the glucose levels are getting lower and lower, your body produces glucagon which will then trigger a cascade of events to increase your blood glucose levels. This can be done by mobilizing stored glycogen (mostly from the liver) or producing new glucose via gluconeogensis - a process that relies heavily on amino acids, first and foremost alanine and glutamine.
Usually, this 1.4-fold or 1.6-fold increase in insulin should trigger a significant (at least transient) decrease in blood glucose. Since the latter wasn't the case in either the fasted or the fed tests the scientists conducted on the twelve subjects, who participated in the open-labeled, three-period trial, it appears more than counter-intuitive that the chronic administration of GABA which does not accumulate in the body and was found to be almost completely absorbed in 60 minutes and to have a half-life of 5h still lead to an GA decrease of approximately 11-12%.

Now this obviously confirms that GABA, due to its ability to increase islet hormonal secretion, has potential therapeutic benefits for diabetes, what the study does not tell us, though, is whether the lack of immediate effects on blood glucose levels can, as the scientists suspect, "in part be attributed to GABA-induced counter regulatory mechanisms, especially elevated glucagon" (Li. 2015) which rose so that the insulin-to-glucagon ratio remained unchanged. Yet while the latter could explain why the subjects did not become hypoglycemic in the face of increased insulin levels, the lack of certainty with respect to the underlying mechanisms makes the study results difficult to interpret.
As a loyal SuppVersity reader you will know that I talked about the potential need to re-balance glucose levels and its paradoxically agitating effects in a 2013 episode of SHR, already.
So what's the verdict, then? Whether and for whom GABA can be useful tool to improve his or her blood glucose management is virtually impossible to tell based on the study at hand. In spite of the fact that the scientists observed only minor adverse events such as transient dizziness and a sore throat, a further reduction of glycated albumin levels is not necessary an advantage that's worth having elevated insulin and glucagon levels. The latter would after all promote the use of proteins or rather amino acids as substrate for gluconeogenesis, the process of which the scientists believe that it is responsible for the non-existent instantaneous glucose response in the study at hand, while the former, i.e. the increase in insulin levels, is well-known for its negative effects on fatty acid oxidation.

Overall, "the verdict" is thus that we need additional research in both, healthy and diabetic individuals to be able to tell for whom the benefits of chronic high(er) dose (3x2g per day) GABA supplementation outweigh potential side effects. If you asked me for an educated guess, though, I would say (pre-)diabetics benefit while the average individual sees either no relevant benefits or detrimental effects due to the repeated need to re-stabilize the blood sugar levels... a phenomenon of which I have by the way previously said and written that it may explain the paradoxically agitating effects the ingestion of GABA has on some individuals - most likely those with already low(ish) blood glucose levels | Comment on Facebook!
References:
  • Li, Junfeng, et al. "Study of GABA in Healthy Volunteers: Pharmacokinetics and Pharmacodynamics." Frontiers in Pharmacology 6 (2015): 260.
  • Prud’homme, Gérald J., et al. "GABA protects human islet cells against the deleterious effects of immunosuppressive drugs and exerts immunoinhibitory effects alone." Transplantation 96.7 (2013): 616-623.
  • Prud’homme, Gérald J., et al. "GABA protects pancreatic beta cells against apoptosis by increasing SIRT1 expression and activity." Biochemical and biophysical research communications 452.3 (2014): 649-654.
  • Purwana, Indri, et al. "GABA promotes human β-cell proliferation and modulates glucose homeostasis." Diabetes 63.12 (2014): 4197-4205.
  • Roohk, H. Vernon, and Asad R. Zaidi. "A review of glycated albumin as an intermediate glycation index for controlling diabetes." Journal of diabetes science and technology 2.6 (2008): 1114-1121.
  • Soltani, Nepton, et al. "GABA exerts protective and regenerative effects on islet beta cells and reverses diabetes." Proceedings of the National Academy of Sciences 108.28 (2011): 11692-11697.
  • Tian, Jide, et al. "γ-Aminobutyric acid inhibits T cell autoimmunity and the development of inflammatory responses in a mouse type 1 diabetes model." The Journal of Immunology 173.8 (2004): 5298-5304.
  • Tian, Jide, et al. "Oral GABA treatment downregulates inflammatory responses in a mouse model of rheumatoid arthritis." Autoimmunity 44.6 (2011): 465-470.
  • Tian, Jide, et al. "γ-Aminobutyric acid regulates both the survival and replication of human β-cells." diabetes 62.11 (2013): 3760-3765.
  • Tian, Jide, et al. "Combined Therapy With GABA and Proinsulin/Alum Acts Synergistically to Restore Long-term Normoglycemia by Modulating T-Cell Autoimmunity and Promoting β-Cell Replication in Newly Diabetic NOD Mice." Diabetes 63.9 (2014): 3128-3134.

Artificial Sweetener Saccharin Increases Weight Gain in Rodent Study Without Increasing Food Intake | Plus: Meta-Analysis of Human Studies Says: "No Reason to Worry!"

$
0
0
Should you freak out about a small increase in body weight in a small-scale rodent study that is attributed to the consumption of saccharin in yogurt?
While epidemiological studies show that the consumption of products containing non-nutritive sweeteners (NNS) is associated with increased adiposity (Colditz. 1990; Fowler. 2008), type 2 diabetes mellitus (T2DM), metabolic syndrome and cardiovascular disease (Dhingra. 2007; Lutsey, Steffen. 2008). A mechanistic link between aspartame, sucralose, stevia & co and weight gain as well as its ill metabolic and cardiovascular consequences in humans is non-existent (learn more).

Rather than weight increases controlled human studies show that the consumption of artificially sweetened foods promote, not hinder the loss of body fat (Sørensen. 2014).
You can learn more about sweeteners at the SuppVersity

Aspartame & Your Microbiome - Not a Problem?

Will Artificial Sweeteners Spike Insulin?

Sweeteners & the Gut Microbiome Each is Diff.

Chronic Sweeten-er Intake Won't Effect Microbiome

Stevia, the Healthy Sweetener?

Sweeteners In- crease Sweet- ness Threshold
In animal models, though, the results have been more conflicting. While many studies show no effect of artificial sweetener consumption, the latest stud by Kelly Carraro Foletto and colleagues is not the first rodent study to suggest that non-nutritive sweeteners may also interfere in the regulation of compensatory appetite promoting weight gain (Davidson. 2011; Polyák. 2010; Rogers. 1988). This does yet not refute the findings of one of the latest meta-analysis of the effects of low-energy sweetener consumption on energy intake and body weight in man - a meta-analysis published in Nature's prestigious International Journal of Obesity that says...
Figure 1: The forest plots of the practically most relevant data of individual and combined effect sizes for sustained intervention studies comparing the effects on body weight of sweeteners versus sugar (upper panel) and versus water (lower panel) shows that not a single long(er) term study found negative effects - the exact opposite is the case. Even compared to water the use of low-energy sweeteners (artificial or not) lead to measurable, yet not always significant decreases in body weight in human trials (Rogers. 2015).
"that the balance of evidence indicates that use of LES [low or no energy sweeteners] in place of sugar, in children and adults, leads to reduced EI and BW, and possibly also when compared with water" (Rogers. 2015 | my emphasis).
And with respect to the often-cited "evidence" from animal and observational studies, the autors of the meta-analysis submit that...
"[...] the present review of a large and systematically identified body of evidence from human intervention studies, with varying designs, settings and populations (including children and adults, males and females, and lean, overweight and obese groups), provide no support for that view. The question then is whether those hypotheses should be rejected or whether, as seems unlikely, the relevant human intervention studies are consistently flawed in a way that leads, in most cases, to exactly the opposite outcome" (Rogers. 2015)
I do thus want to warn you: Do not overrate the already relatively small amount of extra-weight the rodents in saccharin group of Foletto's recent study gained (see Figure 2, left).
Figure 2: Cumulative weight gain and total cumulative energy intake of (only) 16 male Wistar reds fed diets that were supplemented with either saccharin-sweetened or non-sweetened yogurt added (Foletto. 2015)
In a previous study, Folleto et al. had already observed that saccharin can induce weight gain when compared with sucrose in Wistar rats despite similar total caloric intake. In their latest study they did not try to prove that this effect is independent of the rodents' energy intake and mediated by insulin-resistance and / or modified levels of leptin and PYY in the fasting state.
Was it fat they gained or lean tissue mass? Well, I would like to answer these important questions, but Foletto did not disclose (or not even measure?) this important parameter. The practical relevance and reliability of their results is further reduced due to the small cages (44x34x16 cm individual cages) into which the rodents were confined to reduce their voluntary physical activity during the 14 weeks of the experiment, as well as the exclusion of rats who didn't consume the aspired 70% of the planned 75 kcal in form of yogurt per week (the number of rats who fell into this category is also not disclosed).
To this ends, the researchers randomly assigned 16 male Wistar rats to receive ~78kcal per week from either saccharin-sweetened (0.3% saccharin) yogurt or non- sweetened yogurt (0.5 kcal/g) in addition to chow (2.93 kcal/g) and water ad lib. For 14 weeks, Foletto, et al. measured the total food intake (from yogurt and chow) daily and the weight gain on a weekly basis (the results are plotted in Figure 2). Fasting leptin, glucose, insulin, PYY and HOMA-IR levels were measured only at the end of the 14-week study period, though.
Table 1: In view of the fact that any existing negative effects of dietary sweeteners may well be compound-specific. It is certainly worth noting that saccharin is no longer used in modern sweetener formulations of sodas (Wikipedia. 2015)
In spite of the already reported ~5% increase in cumulative weight gain over 14 weeks (p=0.027), the researchers found no differences in HOMA-IR (=insulin resistance), fasting leptin or PYY levels between groups that could mechanistically explain why the rodents who received saccharin sweetened yogurt gained more weight than their peers who received non-sweetened yogurts.
Measurable weight increases are a common pattern in rodent studies particularly for the (today rarely used) artificial sweetener saccharin. It is thus well possible that any existing negative effects are compound-specific. For aspartame, for example, similar evidence is rare to non-existent.
Bottom line: In the absence of a proven theory about the mechanism that may trigger the increased weight gain and in view of the lack of health-relevant data (no information about the body composition of the rodents) and health-relevant side-effects you would usually see in response to pathologic weight gain (changes in insulin resistance, leptin or PYY), I can only refer you back to the quote from the latest meta-analysis of the effects of low- to no-energy-sweetener intake on food intake and weight gain in humans, which say that "the balance of evidence indicates that use of LES [low or no energy sweeteners] in place of sugar, in children and adults, leads to reduced EI and BW, and possibly also when compared with water" (Rogers. 2015).

Furthermore, more relevant evidence from human clinical trials supports the use of artificially sweetened foods as dieting aids (Sørensen. 2014 | learn more).

Whether that's enough to convince you that the unproven negative effects of saccharin on caloric expenditure or increases in the glucose transport mediated by gut sweet-receptors, of which Foletto et al. speculate that they may explain the results of their study, are relevant enough to avoid non-nutritive sweeteners altogether is now up to you. For me it's not enough... | Comment on Facebook!
References:
  • Foletto, Kelly Carraro, et al. "Sweet taste of saccharin induces weight gain without increasing caloric intake, not related to insulin-resistance in Wistar rats." Appetite (2015).
  • Rogers, P. J., et al. "Does low-energy sweetener consumption affect energy intake and body weight? A systematic review, including meta-analyses, of the evidence from human and animal studies." International Journal of Obesity (2015).
  • Sørensen, Lone B., et al. "Sucrose compared with artificial sweeteners: a clinical intervention study of effects on energy intake, appetite, and energy expenditure after 10 wk of supplementation in overweight subjects." The American journal of clinical nutrition (2014): ajcn-081554.

Fat-Blocker Effect of Tea Catechins Confirmed (?) in Man - Sign. Abdominal Fat Loss (5-8%) in 12 Weeks W/Out Diet

$
0
0
Tea catechins (which can also be found in black and jasmin tea | see Figure 3) can help you keep particularly unhealthy abdominal fat (Després. 2012) at bay.
It is one thing to have in-vitro and rodent data that green tea can inhibit the digestion of dietary fat (reported previously in the SuppVersity Facebook News); it is another thing, however, to have a human study like the one Makoto Kobayashi and colleagues are about to publish in the peer-reviewed scientific journal Food & Function that shows that the "[i]ngestion of a green tea beverage enriched with catechins with a galloyl moiety (THEA-FLAN 90S) during a high-fat meal reduces body fat in moderately obese adults" (Kobayashi. 2015).

Ok, the abdominal fat loss does not, as the previous quote from the conclusion appears to suggest, occur instantly right after you've consumed your first tea w/ a single meal.
You can learn more about green tea at the SuppVersity

GT Boosts Res- ting & Ex. Indu- ced Energy Exp.

Water Temp. Influences Effects of Tea

Green Tea Can Reduce Your Testosterone

1L+ of Green Tea per Day Mess Up Your Thyroid

Aluminum, Lead & Arsenic & MORE in Your Tea

Will Drinking Tea Solve Your Sugar Problem?
Rather than that, 124 subjects (two of the initially 126 subjects 2 dropped out for personal reasons unrelated to the trial), 53 men, 71 women, who consumed similar, albeit non-standardized diets (see Figure 1 | note: physical activity was also identical) and began the study with body fat levels of ca. 31-35% had to consume the previously mentioned tea beverage that contained tea catechins (250 mL with 215.3 mg green tea catechins containing 211.0 mg green tea catechins with a galloyl moiety) twice or three times daily during mealtimes for 12 weeks, before the significant reduction in body fat became visible.
Figure 1: Macronutrient composition (in g an % of energy) of the non-energy reduced diets the subjects consumed; the values in the left pie chart represent a group average of all three intervention groups. Since the data is based on food records with photographs, it is probably more reliable than in your average diet study (Kobayashi. 2015).
Now, in view of the fact that this is not the first study to demonstrate weight loss effects in overweight subjects consuming green tea or, as in most other studies, green tea extracts, the word "during" and thus the fact that the green tea beverage was consumed with at least two of the three meals per day should be highlighted as a specific feature of the study at hand that is highly relevant to its interpretation.
Figure 2: Detailed analysis of the rel. change in fat area in the abdominal depot of the subjects (Kobayashi. 2015)
It is after all the requirement that the green tea beverage had to be consumed with a (preferable high fat) meal that allows the authors to conclude that the significant fat loss Kobayashi et al. measured by the means of computer tomography predominantly in the abdominal area are the result of an inhibition or slowing of the intestinal fat absorption and thus warrant the conclusion that "the ingestion of green tea beverages enriched with CGM together with high-fat meals may be an effective strategy for reducing body fat in moderately obese adults" (Kobayashi. 2015) - an observation of which I would like to add that the underlying mechanism is not 100% certain.
What about weight and, even more importantly, muscle loss? No, losing lean mass was not an issue in, because weight loss (-0.6 and -0.8% in the low and high dose group, respectively | measured by bio-electrical impedance vs. computer tomography as it was the case for the abdominal fat area) was actually not an issue, either. If you want to measure your success on the scale, green tea is thus not going to be the "diet tool of choice" (unless you use it alongside an energy-reduced diet)... however, if you take into account that the placebo group actually did what the average Westerner does, these days, i.e. gain weight and body fat over the 12-week study period, you may argue that you can still see the results on the scale which could finally stand still after years of displaying subtle, but eventually relevant increases in body weight.
The authors base their conclusion that it is "unlikely that absorbed green tea CGM leads to increased energy expenditure, followed by reduced abdominal body fat area" (Kobayashi. 2015) on two reasonable, but experimentally (in this study) not confirmed assumptions which are that little to no catechins actually made it into the bloodstream, because ...
  1. the low caffeine content of the beverage limits the bioavailability of EGCG & co (caffeine enhances its bioavailability | Nakagawa. 2009) and
  2. the ingestion of the beverage with a meal has been shown to significantly reduce the bioavailability of green tea catechins in comparison to the fasted state (Chow. 2005).
The assumption that its just a blockade of the digestion of fat becomes even more questionable, if you (re-)read my 2014 article on the carb blocking effects of tea... Well, eventually, though, you may argue that it does not matter if the reduction in abdominal fat was due to thermogenic effects, thermogenic and fat-blocking effects or, as the scientists believe, mediated exclusively an "inhibit[ion] or slowing [of the subjects'] intestinal fat absorption" (Kobayashi. 2015). And let's be honest, I guess you're right. What matters is that there were significant reduction ins abdominal fat (visceral, subcutaneous and total abdominal fat area). Reduction of which the data in Figure 2 tells you that ...
  1. Table 1: Catechin composition of the test beverages.
    the fat loss in the abdominal area was dose dependent - even if the differences between the low and high dose group did not reach statistical significance (for the exact catechin composition see Table 1 on the right) - and that 
  2. roughly 50% of the benefits were lost within only 5 weeks when the subjects stopped consuming the green tea beverage, even though their diet didn't change at all (in fact, they consumed minimally less energy in the withdrawal phase from week 12-17).
Now, (b) is obviously good news for green tea lovers, but bad news for those who cannot imagine consuming green tea containing beverages "for the rest of their lives".
Green tea forever, it is then!? Well, as usual we have to consider what limits the generalizability of the results. Firstly, we are dealing with a group of people who have more than a few pounds of extra-weight on their hips. An abdominal fat loss of 8% in 12 weeks is thus not impossible, but not exactly likely to be seen in someone who starts at a body fat percentage of 15% or less (which is half what the subjects in the study at hand began with).

Figure 3: Catechin content (mg/10ml) of black, green and jasmine tea prepared from commercial tea w/ different infusion times (Bronner. 1998).
The second thing we have to keep in mind is the beverage itself. As you've previously read, it has been enhanced with catechins with a galloyl moiety (CGMs | EGCG, ECG, GCG, CG). Does this mean that you cannot achieve similar results if you simply drink green tea? Luckily, data from Bronner, et al. (1998) suggests otherwise. As you can see in Figure 3, it would take only 100 ml of commercially available freshly brewed (infusion time 3 min) green tea and even less black tea to achieve similar concentrations of EGCG and the other catechins with a galloyl moiety in your tea. Accordingly, the second obstacle to the gene- relizability of the study is actually irrelevant.

Third- and lastly, there's yet still the fast reversal of the effects which suggests that it is necessary to become a habitual tea drinker to see long-term / lasting benefits of green tea (or as the data in Figure 3 suggests even catechin containing tea in general) on your body weight and, more importantly, body fat you're carrying around | Comment on Facebook!
References:
  • Bronner, W. E., and G. R. Beecher. "Method for determining the content of catechins in tea infusions by high-performance liquid chromatography." Journal of Chromatography A 805.1 (1998): 137-142.
  • Chow, HH Sherry, et al. "Effects of dosing condition on the oral bioavailability of green tea catechins after single-dose administration of Polyphenon E in healthy individuals." Clinical Cancer Research 11.12 (2005): 4627-4633.
  • Després, Jean-Pierre. "Body fat distribution and risk of cardiovascular disease an update." Circulation 126.10 (2012): 1301-1313.
  • Kobayashi, Makoto, et al. "Green tea beverages enriched with catechins with a galloyl moiety reduce body fat in moderately obese adults: a randomized double-blind placebo-controlled trial." Food & Function (2016).
  • Nakagawa, Kiyotaka, et al. "Effects of co-administration of tea epigallocatechin-3-gallate (EGCG) and caffeine on absorption and metabolism of EGCG in humans." Bioscience, biotechnology, and biochemistry 73.9 (2009): 2014-2017.

Training "On Cycle", Done Right - Women See Much Better Results When Periodization is in Line W/ Menstrual Cycle

$
0
0
Yes, I could have exploited the ambiguity and called this article "Training 'On Cycle', Done Right - Women See Much Better Results When Periodization is in Line W/ Their Period", but let's be honest: This is a science website and that's neither scientific, nor actually funny, is it?
As a man, I have to admit to be at best well-read, yet not experienced in all things "menstrual cycle". So, while I do only know from the (very different things) I've heard from (ex-)girl friends about how they feel during the different phases, I do know that the hormonal differences in the luteal phase, with high levels of progesterone and estrogen, and the follicular phase with low progesterone and eventually increasing estrogen levels are pronounced enough to cause much more than just mood disturbances.

For many trainers, however, the estrous cycle is still a closed book. "Can you train, or not!?" Especially male trainers are not just insensitive when they ask their protégées this question, they may also be missing out on a chance to maximize their clients' training progress. That's at least what a recent 4-months study from the Umea University in Sweden (Wikström-Frisén. 2015) suggests.
Learn more about the (often ;-) small but significant difference at the SuppVersity

1g PRO per 2g CHO + Circuit T. for Women?

Is the Optimal Exercise Order Sex-Specific?

1-3mg Melatonin Shed Fat W/Out Diet & Exercise

Not Bulky! Lifting Will Make Toned & Strong.

How to Really Train Like a Woman

Sex-Differences in Fat Oxidation - Reviewed
According to Wikström-Frisén and colleagues, "high frequency periodized leg resistance training during the first two weeks of the menstrual cycle is more beneficial to optimize training, than the last two weeks" (ibid. 2015). Now, "beneficial" is obviously a very loosely defined term. When I am telling you, though, that power, strength and lean body mass gains all benefited from the right timing of the workouts (in the first two weeks of the estrous cycle), I will hopefully have every women's and every trainers' attention (even though, I guess I will lose even more of the male bros, now).
Figure 1: Relative changes in lean mass (DXA data), measures power and strength (torque) in 59 trained women in response two weeks of frequent leg-training in the first or second two weeks of their estrous cycle (Wikström-Frisén. 2015).
While all the aforementioned increases in the women who trained in the first two weeks of their estrous cycle were statistically significant (for all, but the quad torque test | +4.4% the statistical significance also survived the Benferroni corrections), the women in the group for whom the periodization scheme had a focus on the second two weeks of their menstrual cycle, saw no significant changes in lean mass and power and a significant reduction in quad strength (see Figure 1). Since the latter lost its statistical power, after Benferroni corrections, though, one could say that the changes the Swedish researchers observed in the 2nd weeks group were practically meaningless.
What about women on oral contraception? The scientists recruited 32 young women on oral contraceptives and 27 women who didn't use oral contraceptives and a re-analysis of the data in Figure 1 didn't show significant inter-group differences between the two groups. In other words, the data in Figure 1 and thus the main findings are relevant for "all" resistance training young women, irrespective of whether they're taking contraceptives, or not. The only difference is that you go by the contraceptive (CC), instead of the estrous cycle and place the high frequency training period in the first, not the last two weeks of the CC cycle.
"Meaningless changes", however, are not meaningless results. In fact, the exact opposite is the case. These results tell trainers and female trainees, alike, that abandoning their protégées / their own
  • regular non-periodized training, i.e. three leg training workouts per week that consisted of leg presses and leg curls (3x sets @ 8-10RM, 1-2 minutes rest between sets; progressive increase of weight by 2-10% whenever the subjects could perform 3x10 reps with a given weight) 
for 4-months and switching to a periodized 2-week high- vs. 2-week low-frequency training, where they would perform the same 48 workouts in either
  • high-frequency first cycles, i.e. 5 workouts per week in the first two weeks, 1 workout per week for the last two weeks of each menstrual / contraceptive cycle, or
  • high-frequency last cycles, i.e. 1 workout per week in the first two weeks, 4 workouts per week for the last two weeks of each menstrual / contraceptive cycle,
would have beneficial effects on their progress only if they increase the frequency during the early phase of the cycle. 
Figure 2: Comparison of the relative changes in the periodization group (high frequency in the first two weeks of the menstrual / CC cycle) vs. control group (three workouts per week for 4 months | Wikström-Frisén. 2015).
Ok, if you compare the periodization group to the control group which kept the regular "three workouts per week"-frequency (see Figure 2, green bars) was maintained, the "advantages" of periodizing "correctly" are not as pronounced as they are in comparison to doing it the "wrong" way. Even though, only the hamstrings appear to benefit to a large extent from periodization, though, benefits exist.

What's even more important, though, is the simple, but really important revelation (or for the few of you who have read about this before e.g. in Reis et al. (1995) "confirmation") that a woman's menstrual and similarly her contraceptive cycle must be aligned to her training schedule. Obviously, the implications will have to be further explored in future studies. Studies, of which I hope, that they will be using smarter periodization schemes which acknowledge that training only once a week is simply not enough... ;-)
SuppVersity Classic: Train Like a Woman: Common Misconceptions About Training & Eating for A Cover-Model Physique - An Interview With Sports Nutritionist & Strength Coach Orit Tsaitli | learn more
Bottom line: Before I try to put things into perspective, I should mention that the participants of the study who were recruited at local gyms, were not jut healthy, non-smokers and had regular menses, they were also experienced trainees. All of them had been doing leg presses and leg-curls for several months - in fact, on average for 3.5 years. Against that background, even non-statistical significant inter-group differences as they were observed between the periodization (5 per week, 1 per week) and the control group (3 per week) may be practically relevant, because they may help experienced trainees to break through plateaus.

With that being said, I personally think of this study as one study in a series of studies that will hopefully elucidate how women can adapt their training regimen to the repetitive changes in the hormonal milieu of their bodies.

If we are honest with ourselves, the fact that Wikström-Frisén's results come as a surprise to most of us is only further evidence of how wantonly exercise scientists and trainers, alike, have hitherto neglected the peculiarities of the female physiology and endocrinology | Comment on Facebook!
References:
  • Reis, E., U. Frick, and D. Schmidtbleicher. "Frequency variations of strength training sessions triggered by the phases of the menstrual cycle." International journal of sports medicine 16.8 (1995): 545-550.
  • Wikström-Frisén, L., C. J. Boraxbekk, and K. Henriksson-Larsén. "Effects on power, strength and lean body mass of menstrual/oral contraceptive cycle based resistance training." The Journal of sports medicine and physical fitness (2015).

GYM-Science Update: Bands Aid W/ Deadlifts? 16x1 or 4x4 for HIIT? Kettlebell HIIT Workout Better Than HIIT-Cycling?

$
0
0
Deadlifts w/ bands as they were done in the Galpin study (original photo from Galpin's 2015 study | see below).
Time for a news-quickie with the latest science to use at the gym - either for your workouts or just to impress the bros with your knowledge. I mean, who else reads and understands all the latest papers in the #1 strength and conditional journal on earth? Well, you do... ok, you read my laymen summaries, but your bros don't have to know that, do they?

Ok, that's enough of the pseudo-comedian warm-up, let's deadlift the first scientific paper... oh,yeah: Actually the paper is about deadlifting, deadlifting with resistance bands as it is shown in the photo on the right, where a subject performs the deadlift on a force plate.
Read more about exercise-related studies at the SuppVersity

Tri- or Multi-Set Training for Body Recomp.?

Aug '15 Ex.Res. Upd.: Nitrate, Glycogen, and ...

Pre-Exhaustion Exhausts Your Growth Potential

Full ROM ➯ Full Gains - Form Counts!

BFR-Preconditio- ning Useless for Weights?

Study Indicates Cut the Volume Make the Gains!
  • Deadlift with bands for power and speed - Galpin et al. (2015) investigated how using bands while deadlifting at different loads, namely 60 and 85% of one's individual 1RM, i.e. the maximal weight you can lift for exactly one perfect rep, would influence the power and velocity at which twelve trained men (age: 24.08 ± 2.35 years, height: 175.94 ± 5.38 cm, mass: 85.58 ± 12.49 kg) with deadlift 1 repetition maxima (1RM) of 188.64 ± 16.13 kg pulled the weight off the floor.

    The results of the study show that there were significant peak (yet not relative) power changes irrespective of whether only 15% of the total resistance (group B1) or 35% of the total resistance (group B1) came from the bands (vs. the actual weight).
    Figure 1: Relative changes in power and bar velocity (compared to training w/out bands = control); * denotes sign. difference to control, ** denotes significant difference to control and light bands (Galpin. 2015)
    The effect became even more pronounced and extended from peak to average power, when the subjects used the heavier (85% 1RM) weights. In this condition using bands lead to greater peak and relative power production and lowered the velocity significantly compared to the control condition in which the subjects lifted at the same total level of resistance, albeit without bands (all values in Figure 1 are relative differences).

    For trainees the data in Figure 1 could be highly relevant, because it indicates that heavy bands should be used, when "prescribing the deadlift for speed or power, but not maximal force" (Galpin. 2015). If that's not you, i.e. you're not training for speed and power, but e.g. for size, future long(er)-term studies will have to show whether using bands makes a difference with respect to this study training goal.
  • Interval length, can you really pick whichever suits your best? Even though a recent study by Wesley Tucker et al. (2015) shows that the rate of perceived exertion, as well as the mean heart rate of 14 recreationally active and thus not exactly jacked males who participated in their latest study were identical on 4x4 and 16x1 high intensity interval protocols (i.e. 4 intervals à 4 minutes vs. 16 intervals a 1 minute | see Figure 2), seasoned SuppVersity readers will probably remember that previous studies showed highly relevant differences in the long(er) term effects which obviously cannot be measured in an acute phase study like the one at hand.
    Figure 2: Illustration of the two HIIT protocols, incl. warm-up and cool down on cycle ergometers. White boxes are intervals during which the subjects were supposed to exercise at 90% of their peak heart rate (during the 16x1 protocol this was not achieved by all study participants in the latter intervals, though | Tucker. 2015).
    To be more specific, previous studies on high intensity interval training suggested that athletes who want to increase their VO2 max benefit more from fewer longer intervals, while "Mr. and Mrs. Average" could be better off improving their body composition and metabolic rate with a higher number of short intervals (even as short as 15 seconds in the Tabata protocol). Against that background and in order to explain or contradict the previous findings, it may be worth to consider other study outcomes in Tucker et al. (2015). Study outcomes which did differ. The total energy expenditure, for example, was 19% higher during the 16x1 protocol (p < 0.001) which is in line with the previously referenced recommendation of short intervals for people who are trying to lose weight.
    Figure 3: VO2, heart rate, and energy expenditure during the two HIIT protocols (watch the units! I converted them to be able to put all data into the same graph | Tucker. 2015).
    The VO2 uptake, as well as the maximal heart rates, which could be of interest for endurance athletes, on the other hand, were higher in the 4x4 protocol - a finding that would likewise support the previously voiced recommendation that (endurance) athletes should torture themselves with long(er) intervals to trigger further adaptations in VO2max and heart rate at a given power output.

    Overall, the study at hand will thus not revolutionize your training, but if you haven't read the previous SuppVersity articles, you may still have gotten some new insights into how you may want to adapt your HIIT training in the future.
  • Kettlebell or cycle ergometer? Which do you chose for your HIIT sessions? I've written about kettlebell swings as muscle builders before and I've also hinted at the possibility of using the "bells" for your HIIT workouts. Now, a recent study by Williams and Kraemer shows that
    "[kettlebell high intensity interval training aka] KB-HIIT may [even] be more attractive and sustainable than [sprint interval cycling aka] SIC and can be effective in stimulating cardiorespiratory and metabolic responses that could improve health and aerobic performance" (Williams. 2015).
    The purpose of the study was - you probably already guessed it - to determine the effectiveness of a novel exercise protocol we developed for kettlebell high-intensity interval training (KB-HIIT) in comparison to the classic, standard sprint interval cycling (SIC) exercise protocol most people associate with equipment-based HIIT sessions. To this ends, the researchers from the Southeastern Louisiana University had eight "very active" young men (mean age 21.5 years; body fat 18.52 +/-3.04%, fat free mass 67.44 kg of a total weight of 82.95 kg) complete two 12-minute sessions of KB-HIIT and SIC in a counterbalanced fashion.
    Figure 4: Overview of the KB-HIIT workout (my illustration).
    "In the KB-HITT session [exercises see Figure 4, mean weight depending on exercise and subject 10-22 kg], 3 circuits of 4 exercises were performed using a Tabata regimen.

    In the SIC session, three 30-second sprints were performed, with 4 minutes of recovery in between the first 2 sprints and 2.5 minutes of recovery after the last sprint" (Williams. 2015)
    The study's within-subjects' design over multiple time points allowed Williams and Kraemer to compare the oxygen consumption, the respiratory exchange ratio (RER, a marker of the ratio of fat to carbohydrates that is used as fuel during the workout), the tidal volume (TV, the volume of air that is inspired or expired in a single breath during regular breathing), the breathing frequency (f), the subject's minute ventilation (VE), caloric expenditure rate (kcal/min), and their heart rate (HR) on an individual basis between the exercise protocols. In conjunction with the total caloric expenditure which was likewise measured / calculated and compared. The total amount of data the authors collected was thus quite large.
    Figure 5: Mean total energy expenditure in kcal during the KB and SIC sessions (Williams. 2015)
    Significant inter-group differences were found for VO2, RER, TV and total energy expenditure, with VO2 and total energy expenditure being higher and TV and RER being lower in the KB-HIIT compared with the cycle ergometer HIIT protocol. For f, VE, the energy expenditure per minute and the heart rate, there were no general inter-group differences, but "only" significant group × time interactions. Practically speaking, this means that they changed differently over the course of the whole protocol and are thus maybe relevant for certain athletes, yet not for the general public.

    Overall, the William's and Kraemer's study does therefore support the notion that doing kettlebell HIIT workouts is probably at least on par with the classic cycling HIIT sessions. In view of the increased total caloric expenditure and the lower RER, which signifies a significantly higher fat oxidation during the workout, it is even possible that KB-HIIT would be the better choice for dieters than doing HIIT on a cycle ergometer. Since there is no direct link between fat oxidation and/or energy expenditure during workouts and fat loss, however, long(er)-term studies are necessary to find out whether doing KB-HIIT is in fact more than a equivalent and for many of you maybe funnier alternative to doing HIIT on a cycle ergometer. 
Block Periodization - Training revolution or simple trick? This is what we have to ask ourselves in view of the results of a previously discussed study from 2014 | Read the full SV-Classic article here!
Bottom line: That's it for today; so I suggest you take what you learned, pack it in your gymbag and go and impress your bros at the gym ;-) I am just kiddin'... actually I hope that you can really use some of the information in today's installment of the SuppVersity Short News to make your workouts more productive, more enjoyable and/or simply more versatile.

Personally, I will probably give the KB-HIIT workout a try,... and that even though I expect it to be much harder than cycling which is something I am already used to. But hey, isn't that what training is all about? You have to challenge your body - even if that means conquering your weaker self.

I mean, we all know that as soon as you are staying within the cozy comfort zone of doing the same exercises with the same weights workout after workout your progress will stall; and unless you are one of those people who hit the gym to be able to talk to their athletic friends, that's certainly nothing you should aim for | Comment on Facebook!
References:
  • Galpin, AJ, Malyszek, KK, Davis, KA, Record, SM, Brown, LE, Coburn, JW, Harmon, RA, Steele, JM, and Manolovitz, AD. Acute effects of elastic bands on kinetic characteristics during the deadlift at moderate and heavy loads. J Strength Cond Res 29(12): 3271–3278, 2015
  • Tucker, WJ, Sawyer, BJ, Jarrett, CL, Bhammar, DM, and Gaesser, GA. Physiological responses to high-intensity interval exercise differing in interval duration. J Strength Cond Res 29(12): 3326–3335, 2015
  • Williams, BM and Kraemer, RR. Comparison of cardiorespiratory and metabolic responses in kettlebell high-intensity interval training versus sprint interval cycling. J Strength Cond Res 29(12): 3317–3325, 2015

Resting 3 vs. 1 Min. Between Sets Pays Off: Greater Size + Strength Gains - Probably Mediated by 15% Higher Volume

$
0
0
Resting long enough to maximize your training volume could be the key to success, i.e. strength and size gains.
If you have been following the various affords to ascribe differences in strength and, even more so, size-increases to a specific training variable, you will remember that the only promising parameters that appear to be supported by more than the literal "outlier study" are training load and volume.

Of these, the former is pretty much uncontested. The latter, however, is still questioned by a camp of inconvincible skep- tics, who simply ignore the fact that there's ample evidence that "[h]igher-volume, multiple-set protocols have consistent- ly proven superior over single set protocols with respect to increased muscle hypertrophy" (Schoenfeld. 2010).
It would be interesting to see if rest periods should also be periodized!

30% More on the Big Three: Squat, DL, BP!

Block Periodization Done Right

Linear vs. Undulating Periodizationt

12% Body Fat in 12 Weeks W/ Periodizatoin

Detraining + Periodization - How to?

Tapering 101 - Learn How It's Done!
What still isn't clear, though, is the role of other training parameters, such as the time you take to recover between multiple sets and exercises aka the "rest intervals". As Schoenfeld et al. point out in the introduction to their most recent study, "several studies have investigated the effects of varying rest interval length on muscular adaptations," (Schoenfeld. 2015) albeit with contradictory results: While Ahtiainen et al (2005) were unable to find a significant inter-group size or strength difference in well-trained subjects (6.6 +/- 2.8 years of continuous strength training) who rested 2 minutes compared to those who rested only 5 minute in response to their 21-week training intervention, Buresh et al (2005) reported more recently that significantly greater size increases of the arms and a trend for greater muscle hypertrophy in the legs in young, albeit untrained subjects who rested for 2.5 minutes instead of just one.
Figure 1: Previous studies found "conflicting" evidence. While Ahtiainen et al. found no effects of 2 vs. 5 minutes in trained, Buresh et al. found effects of 2 vs. 1 minutes rest in untrained subjects. With different subjects, different workouts and most importantly different rest times that were compared it is yet not exactly right to say that the studies contradict each other.
Now, obviously, the ostensible "contradiction" I alluded to in the previous paragraph does eventually not exist. With trained vs. untrained subjects, different workout protocols and most importantly different rest intervals (1 vs. 2 minutes and 2 vs. 5 minutes) the studies by Ahtiainen and Buresh cannot really contradict each other. The same must be said of an even more recent study by Villanueva et al. (2014) the surprising findings of which, i.e. "longer rest periods compromise the gains of older trainees", I've discussed last year, already.
What about the lack of different increases in strength endurance? I have to admit that I do not discuss this finding of the study in detail. While one would expect that shorter rest intervals would produce greater strength endurance adaptations, the researchers observed the opposite, an - albeit non-significantly larger increase in strength endurance in the 3-minute-rest group that correlated with the increase in 1RM strength. Further studies will have to show what the underlying mechanism of this counter-intuitive observation is and whether it may be muscle specific, i.e. occur only in the upper, but not in the lower body.Eventually, however, this does not change that there is, as Schoenfeld et al. write that "a need for more research to provide greater clarity on the topic" (Schoenfeld. 2015). A "clarity" Schoenfeld et al. sought to find with a study that "used current rest interval recommendations for hypertrophy and strength of 1 versus 3 minutes, respectively, and employed validated measures to directly assess site-specific changes in muscle thickness" (ibid). In that, the researchers speculated that ...
"[c]onsistent with generally accepted guidelines on the topic (Willardson. 2006), we hypothesized that short rest intervals would produce greater increases in muscle growth and local muscle endurance while long rest intervals would result in superior strength increases" (Schoenfeld. 2015).
As you will know if you didn't miss the headline of this SuppVersity article, this hypothesis was only partly validated. The data in Figure 2 confirms that the subjects, "experienced lifters (defined as consistently lifting weights for a minimum of 6 months and a back squat / body weight ratio ≥ 1.0)" (Schoenfeld. 2015), gained significantly more strength, when they rested 3 versus just 1 minute between the 3 sets of their three weekly workouts (Figure 2 does also tell you that the strength endurance increases were identical in both groups).
Figure 2: Changes in markers of strength and strength endurance; * denotes significant pre- vs. post difference, # denotes significant inter-group difference (here in favor of long(er) rest periods | Schoenfeld. 2015).
What was Schoenfeld et al. did not find, however, were increased size gains in the short-rest period group whose 24 workouts that were performed on non-consecutive days over the course of the 8-week study period, were otherwise identical with those of the long-rest period group and comprised a total of 7 exercises for all major body parts, namely...
  • three leg exercises, i.e. barbell back squats, plate-loaded leg presses, and plate-loaded leg extensions), 
  • two exercises for the anterior torso muscles, i.e. flat barbell presses and seated barbell military presses, and 
  • two exercises for the posterior torso muscles, i.e. wide-grip plate-loaded lateral pulldowns, and plate-loaded seated cable rows
This is a highly significant result even for you who is - according to an older SuppVersity Poll - probably training according to a split regimen, albeit most likely with very similar exercises. What may be different from the some, but obviously *smile* not your workout though, is that the supervision by members of the research team ensured that the subjects stuck to the prescribed cadence of 1 second for the concentric and "approximately 2 seconds" (ibid.) for the eccentric part of every the exercise. This as well as the imperative progression to higher weights, whence the prescribed number of 8-12 reps per set could be performed is unfortunately overlooked by many recreational trainees - with disappointing consequences in the form of inferior or even no size and strength gains, by the way... but I am digressing, let's rather take a look at the already mentioned, unexpectedly superior strength size gains in the long(er) rest interval group (Figure 3).
Figure 3: Changes in muscle thickness and corresponding effect sizes; * denotes significant pre- vs. post-changes, # denotes significant inter-group differences; overall it is obvious that there's a long(er) rest advantage (Schoenfeld. 2015).
As the single "#" in Figure 3 tells you, the inter-group differences and thus the advantage of the long(er) rest intervals was statistically significant only for the quads, though. If we also take into account the lack of statistically significant effects on the sleeve sizes (biceps and triceps) in the short rest interval group, as well as the obvious differences in effect sizes (Figure 3, right), there's yet little doubt that the hypothesis that shorter rest intervals yield greater size increases must be considered falsified - at least under the given experimental conditions (trained subjects, three full-body workouts per week, standard hypertrophy set and rep-ranges, etc.).
So what's the verdict, then? At first sight it would appear as if the study at hand would totally refute the idea that shorter rest intervals, or I should clarify, rest intervals that are as short as 60s (*) should have a place in your training regimen altogether (*Schoenfeld, et al. rightly point out that Ahtiainen's result suggest that even 120s could have been enough time to rest - it is thus important to give precise recommendations for rest intervals, not something as arbitrary "short" vs. "long"). We should not forget, though, that even a thoroughly conducted study like the one at hand has its limits and definite conclusions should not be drawn hastily based on a single study result - even if it is, as in this case, corroborated by the results of Buresh et al (2009).

Figure 4: The total training volume in the long(er) rest period group (3 vs. 1 minutes of rest) was on average 15% higher. Due to the relatively high inter-individual differences and the relatively low number of participants (N=21) a statistically significant correlation between the weight lifted per week (total volume in kg as in the figure) and the surprisingly superior gains in the 3-min-rest group could not be established (based on Schoenfeld. 2015).
With that being said, a secondary outcome of the study provides a reasonable explanation for why both, the strength and the size gains benefited from long(er) rest intervals: The total training volume I've plotted in Figure 4. As Schoenfeld et al. point out, the latter has previously been suspected to mediate the effects of inter-set rest on strength and hypertrophy on total training volume and strength (Henselmans. 2014). A correlation between the visible differences in training load (see Figure 4) and the magnitude of training adaptations, however, could not be found in the study at hand. As the authors highlight, the reason for this lack of statistical significant correlations may yet be a simple lack of statistical power, so that one "cannot rule out the possibility that the greater training load achieved by the longer rest period group was responsible for the greater training adaptations" (Schoenfeld. 2015 | Buresh et al. found such an effect for the upper, yet not for the lower body).

Personally, I tend to believe that, with a higher number of subjects, a correlation between the total training volume that was on average 15% higher in the 3 vs. 1 minute rest group could have been established. This, in turn, would support the notion that long(er) rest periods - maybe, as Schoenfeld et al. suggest based on the data from Ahtiainen's study, at least 120s - are necessary to maximize the total training volume and thus the overall = strength and hypertrophy response to workouts. Whether that is true for all types of workouts (e.g. split- vs. full-body), all subject groups (e.g. people who are used to short rest periods vs. those who are not) as well as special athletic requirements (e.g. power vs. strength & hypertrophy) will have to be determined in future studies, however | Comment on Facebook!
References:
  • Ahtiainen, Juha P., et al. "Short vs. long rest period between the sets in hypertrophic resistance training: influence on muscle strength, size, and hormonal adaptations in trained men." The Journal of Strength & Conditioning Research 19.3 (2005): 572-582.
  • Buresh, Robert, Kris Berg, and Jeffrey French. "The effect of resistive exercise rest interval on hormonal response, strength, and hypertrophy with training." The Journal of Strength & Conditioning Research 23.1 (2009): 62-71.
  • Henselmans, Menno, and Brad J. Schoenfeld. "The Effect of Inter-Set Rest Intervals on Resistance Exercise-Induced Muscle Hypertrophy." Sports Medicine 44.12 (2014): 1635-1643.
  • Schoenfeld, Brad J. "The mechanisms of muscle hypertrophy and their application to resistance training." The Journal of Strength & Conditioning Research 24.10 (2010): 2857-2872.
  • Schoenfeld, et al. "Longer inter-set rest periods enhance muscle strength and hypertrophy in resistance trained men." Journal of Strength and Conditioning Research (2015): Publish Ahead of Print.
  • Villanueva, Matthew G., Christianne Joy Lane, and E. Todd Schroeder. "Short rest interval lengths between sets optimally enhance body composition and performance with 8 weeks of strength resistance training in older men." European journal of applied physiology (2014): 1-14.
  • Willardson, Jeffrey M. "A brief review: factors affecting the length of the rest interval between resistance exercise sets." The Journal of Strength & Conditioning Research 20.4 (2006): 978-984.

Ashwagandha Boosts Size & Strength Increases, Augments Fat Loss & Recovery in 8-Week Resistance Training Study

$
0
0
Ashwaghanda may be for gymrats, too.
Ashwaganda is one of the supplements that has been around forever. While this would suggest that it works, the relatively low number of people who actually use it suggests otherwise and scientific evidence in form of peer-reviewed, non-sponsored studies that would allow us to draw a reliable conclusion with regard to its usefulness for athletes is rare... Well, actually there are only four studies on Withania somnifera, which is also known as Indian Ginseng or Winter Cherry, of which you could say that they are at least relevant to the topic - even though none of them was conducted in resistance trained / training individuals.
Read more about exercise-related studies at the SuppVersity

Tri- or Multi-Set Training for Body Recomp.?

Aug '15 Ex.Res. Upd.: Nitrate, Glycogen, and ...

Pre-Exhaustion Exhausts Your Growth Potential

Full ROM ➯ Full Gains - Form Counts!

Body Pump, Cardio & Exercise Expenditure

Study Indicates Cut the Volume Make the Gains!
There's a study by Raut, et al. that evaluated the "tolerability, safety, and activity of Ashwagandha (Withania Somnifera) in healthy volunteers" from 2012; a study by Sandhu, et al. in which the researchers probed the "effects of Withania somnifera (Ashwagandha) and Terminalia arjuna (Arjuna) on physical performance and cardiorespiratory endurance in healthy young adults" and found an increase in velocity [+3%], relative power [+9%] and VO2 max [+7%] in response to 500mg/day for 8 weeks; a study by Choudhary et al. (2015) which found both, increases in VO2max and quality of life of 50 "athletic" individuals in response to a commercial Ashwaghanda product that goes by the cryptic acronym KSM-66 Ashwagandha; as well as a study by Shenoy, et al. (2012) which found 11%, 16% 16% and 2% increases in time to exhaustion, VO2, metabolic equivalents (METs) and respiratory exchange ratio (RER), respectively (note: the benefits were sign. lower in female study participants, see Table 1), in response to the same amount, i.e. 500 mg/day, of an aqueous root extract of Ashwagandha that has been used by Sandhu et al. two years before.
Table 1: Mean percentage (%) difference of pre-post readings of forty male and female elite (elite here refers to the participation of the athlete in at least state-level events) Indian cyclists in response to 8 weeks on 500 mg of standardized aqueous root extract, which was obtained in the form of capsules from Dabur India Limited (Sandhu. 2012).
With that being I should mention that several studies suggest that your source of Ashwaghanda may well determine its effects. So, any current and future contradictions in the literature may be related to the level of desirable and undesirable "active ingredients" in the tested extracts. Patel, et al., for example, report that 50% of the samples they analyzed in 2015 contained mercury (Hg) at levels "above the permissible limit". Reason enough for the researchers to conclude that the "consumption of drug (Ashwagandha) obtained from polluted areas may cause accumulated side effect as well as the toxic effect of the heavy metals, respectively" (Patel. 2015). In view of the fact that I assume that Wankhede et al. used an (a) heavy-metal free and (b) truly standardized extract with actual steroidal lactones (withanolides, withaferins), saponins and alkaloids like isopelletierine and anaferine in it, in their recent
"prospective, double-blind, placebo-controlled parallel group study to measure the possible effects of ashwagandha extract on muscle strength/size, muscle recovery, testosterone level and body fat percentage" (Wankhede. 2015)
in young men who participated in a standardized resistance training regimen, it is thus not totally impossible that the next best Ashwaghanda product from the internet will produce significantly different results. I guess you should keep that in mind if you plan to go shopping after reading this article. The product Wankhede, et al. used, by the way, was provided by Shri Kartikeya Pharma and Ixoreal BioMed and happened to be the same KSM-66 high-concentration root extract Choudhary et al. used in their likewise very recent study.
Figure 1: Overview of the study design as it is visualized in Wankhede et al. (2015)
I don't want to waste your precious time with speculations, though. Let's talk about Wankhede's recent study, on 57 men (18-50 years), who were randomly allocated to either the treatment group, in which the subjects consumed 300 mg of ashwagandha root extract twice daily, or the control group, which received identically looking starch placebo capsules.
BIA and CK - not the best ways to measure body fat and recovery: What should be noted about these measurements, though, is the fact that body fat levels were measured via bio impedance (BIA) and the recovery was judged based on creatine kinase (CK) values. With BIA being susceptible to variations in hydration status and other sources interference (Kyle. 2004) and the CK-values showing extreme inter-individual variability (learn more), the validity of these outcomes remains somewhat questionable.
Both, the subjects who received the active treatment in form of 2x300 mg/day Ashwagandha, as well as those who received the placebo treatment, underwent identical 8-week resistance training programs; programs, the scientists describe as follows:
"The resistance training program consisted of sets of exercises over major muscle groups in both the upper body and the lower body. [...] Each subject in both groups was asked to come to a training session every other day, with one rest day pe week, for three days per week. Every session began with a warm up consisting of five minutes of low-intensity aerobic exercise. The subjects were instructed to perform, for each set as many repetitions as they could until failure. The subjects were asked to go through the full range of motion and were demonstrated the proper technique for safe and effective weight lifting" (Wankhede. 2015).
The workouts were periodized with increasing number of sets from 1-2 to 3. More specifically, the subjects performed barbell squats, the leg extensions, seated leg curls, machine chest presses, barbell chest presses, seated machine rows, one-arm dumbbel rows, machine biceps curls, dumbbel biceps curls, cable triceps press-downs, dumbbell shoulder presses, and the straight-arm pull-downs in the first two weeks and barbell squat (3 sets) the leg extension (3 sets), the leg curl (2 sets), one chest exercise (flat, incline or decline press or fly, cable cross over, 3 sets), one back exercise (rows, pull up, pull down or seated cable row, 3 sets), another chest exercise (3 sets) another back exercise (3 sets), one biceps exercise or one triceps exercise (curls or extensions, 3 sets), and one shoulder exercise (raises or presses, 3 sets) for the rest of the 8-week study.
Figure 2: Absolute increases in thigh, arm and chest size and reduction in body fat (%) over the course of the 8-week study; the figures above the bars denote the inter-group difference in %, * denotes significant differences (Wankhede. 2015).
Significant inter-group differences were found for almost all of the measured variables: the size increases in the arms and chest, the change in body fat (remember, those are only BIA values), serum testosterone, and CK (remember, this is not a very reliable marker of exercise recovery), as well as the strength increase on the bench press and leg extension machine (1RM, each) differed significantly not just from pre- to post, but also from the supplement to the placebo group (see Figure 2, Figure 3).
Figure 3: Changes in 1RM (kg) strength and testosterone (ng/dL) over the course of the 8-week study; the figures above the bars denote the inter-group difference in %, * denotes significant differences (Wankhede. 2015).
Against that background it seems certainly warranted that Wankhede et al. postulate that their study "confirms previous data regarding the adaptogenic properties of ashwagandha" and it also clearly "suggests it [Ashwaghanda supplementation] might be a useful adjunct to strength training" (Wankhede. 2015). The authors are yet also right, when they point out that their study has...
"[...] the following limitations which should lead us to interpret the findings with some caution: the subjects are untrained and moderately young, the sample size of 50 is not large and the study period is of duration only 8 weeks" (Wankhede. 2015)
Accordingly, Wankhede et al. rightly demand that further "[r]esearch studying the possible beneficial effects of ashwagandha needs to be conducted", research that spans "longer periods of time" and includes "different populations including females and older adults of both genders" (Wankhede. 2015). In this regard, I would like to remind you that the previously discussed results Shenoy et al. published three years ago, in which the sex of the participants had a major impact on the study outcome, make studies comparing male to female resistance trainees particularly appealing - from a science perspective, obviously ;-)
Sometimes lab values are deceiving - specifically if allegedly pathological elevations of kidney, liver and (heart) muscle enzymes (CK) are nothing but a perfectly physiological reaction to exercise | learn more!
So, what's the verdict, then? Yes, this is definitely the most exciting 'Ashwaghanda study', I've seen so far. Next to the limitations Wankhede et al. already discuss in the conclusion of their recently published paper in the Journal of the International Society of Sports Nutrition one should not forget, though, that the methods they chose to determine the body composition and state of recovery of their subjects were appropriate, but not optimal. While the former would have been more reliable if they had used a DXA scan, the latter would actually have to be tested via several post-workout strength tests and auxiliary tests and questionnaires as it was done, for example, by Kraemer et al. (2010).

Enough of the complaints, though. Let's be greatful we even have a study investigating the effects of Ashwagandha on resistance training. Plus, the increases in strength, muscle size (which would be similarly thwarted by cell swelling in both groups when it was tested 'only' two days after the last workout) and testosterone, alone, warrant the authors' already carefully worded conclusion that "ashwagandha supplementation may be useful in conjunction with a resistance training program" (Wankhede. 2015) - even if the underlying mechanism is still unknown and the hypotheses the authors list in the discussion, i.e. (a) increase in testosterone (too low to have significant effects | learn why), (b) decrease in the levels of cortisol (not measured + acute cortisol elevations are associated w/ lean mass gains in strength training individuals | West. 2012), (c) beneficial effects on mitochondrial health and reduced ATP breakdown (observed only in rodents that were exposed to toxins vs. exercise), and (d) antianxiety effects and promotion of focus and concentration that "may translate to better coordination and recruitment of muscles" (Wankhede. 2015), are as the word "hypothesis" implies only hypothetical, i.e. conjectural | Comment on Facebook!
References:

  • Choudhary, Bakhtiar, A. Shetty, and Deepak G. Langade. "Efficacy of Ashwagandha (Withania somnifera [L.] Dunal) in improving cardiorespiratory endurance in healthy athletic adults." AYU (An international quarterly journal of research in Ayurveda) 36.1 (2015): 63.
  • Kyle, Ursula G., et al. "Bioelectrical impedance analysis—part II: utilization in clinical practice." Clinical nutrition 23.6 (2004): 1430-1453.
  • Patel, Dhaval, Harisha C. Rudrappa, and Proshanta Majumder. "A comparative pharmacognostical, physicochemical, and heavy metal analysis on Ashwagandha root obtained from natural and polluted sources." International Journal of Green Pharmacy 9.1 (2015): 14.
  • Raut, Ashwinikumar A., et al. "Exploratory study to evaluate tolerability, safety, and activity of Ashwagandha (Withania Somnifera) in healthy volunteers." Journal of Ayurveda and Integrative Medicine 3.3 (2012): 111.
  • Sandhu, Jaspal Singh, et al. "Effects of Withania somnifera (Ashwagandha) and Terminalia arjuna (Arjuna) on physical performance and cardiorespiratory endurance in healthy young adults." International journal of Ayurveda research 1.3 (2010): 144.
  • Shenoy, Shweta, et al. "Effects of eight-week supplementation of Ashwagandha on cardiorespiratory endurance in elite Indian cyclists." Journal of Ayurveda and integrative medicine 3.4 (2012): 209.
  • Wankhede, Sachin, et al. "Examining the effect of Withania somnifera supplementation on muscle strength and recovery: a randomized controlled trial." Journal of the International Society of Sports Nutrition 12.1 (2015): 43.
  • West, Daniel WD, and Stuart M. Phillips. "Associations of exercise-induced hormone profiles and gains in strength and hypertrophy in a large cohort after weight training." European journal of applied physiology 112.7 (2012): 2693-2702.

Sodium Bicarbonate a Performance Booster for Only 66% of the Athletes? Study Shows Individual & Variable Responses from Zero to + 30% Increase in Maximal HIIT Workloads

$
0
0
Even though, the study at hand confirms that NaHCO3 doesn't work for everyone previous studies show it's worth trying.
You will probably have asked yourselves, whether I had already forgotten about sodium bicarbonate and the performance enhancing effects of pH buffers, right? No, I didn't, but unfortunately, many researchers have... well, many, but not all researchers. Gabriela Froio de Araujo Dias and her colleagues from the University of Sao Paulo, for example, have just released a paper in which they describe the intriguing results of the first bicarbonate study that was specifically designed to (a) determine within- and (b) inter-individual variation that could potentially compromise the magnitude of an effect that's determined based on averages (e.g. if you use bicarb three times and have performance increases of 0.4%, 5% and 0.3% it will look less effective).
You can learn more about bicarbonate and pH-buffers at the SuppVersity

The Hazards of Acidosis

Build Bigger Legs W/ Bicarbonate

HIIT it Hard W/ NaCHO3

Creatine + BA = Perfect Match

Bicarb Buffers Creatine

Beta Alanine Fails to HIIT Back
In the corresponding experiment, the scientists had 15 physically active males (age 25±4 y; body mass 76.0±7.3 kg; height 1.77±0.05 m) complete six cycling capacity tests at 110% of maximum power output (CCT110%) following ingestion of either
  • 0.3 g/kg body mass of sodium bicarbonate (SB | 4 trials) or
  • alcium carbonate placebo (PL, 2 trials).
Just in case you're wondering: Calcium carbonate has no reasonable buffering effect as it will not, as you can see in Figure 1 affect the pH, bicarbonate levels of base excess of the blood in the way bicarbonate does. It is thus the standard choice in corresponding experiments.
Figure 1: Line graphs for blood measurements (mean ± 1SD) at Baseline, Pre-exercise, Post-exercise and 5-min post-exercise. Panel A displays pH; Panel B displays bicarbonate; Panel C displays base excess; Panel D displays lactate. PL trials are represented by dashed lines and SB trials are represented by solid lines (de Araujo Dias. 2015).
As you may already know from previous SuppVersity articles on bicarbonate, the increases in blood pH, bicarbonate, base excess and lactate you see in Figure 1 are important to tell what exactly triggers the net effect of using baking soda as a pH buffer. What every athletes will yet be more interested in, though is whether the buffer allowed the recreationally active men who participated in the study saw statistically significant increases in the total work done (TWD) during the 110% high-intensity cycling capacity test, or not.
Learn more about Serial Loading!
You have problem "stomaching" NaHCO3? If you feelm, like some of the subjects in the study nauseated or even get diarrhea when you ingest a large bolus of sodium bicarbonate at once, try the Serial Loading Protocol from Dreher's 2012 study I discussed in an older SuppVersity article about sodium bicarbonate. That should work even for the most sensitive tummies. That's still no guarantee that it'll work, though, and would - just as the study at hand shows it for the regular bolus administration require some experimentation.
As you can see in Figure 2, the average subject saw the highest improvement in the last of the four trials (7%); an improvement of which statistics tell us that it says that there's 93% chance of general substantial improvement - with lower values for the other trials.
Figure 2: Rel increase (%) in total work (figures over the bars indicate likelihood of relevant benefits and relative increase, e.g. for bar 4: "It's 93% likely that the 7% increase displays a real-world relevant performance increase) - left; Total work done during SB trial as function of total work done during PLA trial - right (de Araujo Dias. 201).
Apropos "other trials", when the scientists removed the subjects who reported sick during trial 1 and trial 3, the results of trial 1 suggest a "likely" benefit (81%) and those of trial 3 a "possible" (50%) benefit. The notion that whether you benefit or not can / will depend on how well you tolerate the bicarbonate solution would also be confirmed by the data in Figure 2, right. The latter is a plot of the ratio of total work done in the sodium bicarbonate trial #4 vs. the control trial; a plot that easily tells us who saw benefits and who didn't because all "winners" are above, while all "losers" are below the transverse line. And since the distance to said line is a marker of the performance increase, you can also see that even among those who did benefit, the benefits ranged from hardly measurable as in subject #7 to a whopping 30% increase in total work done during the high-intensity cycling capacity test in subjects #12.
25g of Baking Soda Will Up Your Squat (+27%) & Bench Press (+6%) Within 60 Min | more
Bottom line: If you belong to the unlucky 33%, who were represented in the study at hand by the 5 subjects the scientists found who didn't benefit in any of the four sodium bicarbonate trials, you could probably still try the serial loading protocol and if that doesn't work either, simply accept that "SB may not always improve exercise" (de Araujo Dias. 2015).

On the flipside, though, you must not give up on baking soda if you didn't see improvements in your first trial, either. Eventually, the data from the study at hand also shows that even in those who benefit the benefit can sometimes be small or even non-existent.

As a trainer or trainee, you should thus keep in mind that sodium bicarbonate, baking soda or NaHCO3 must be taken on multiple occasions in order to categorize yourself or your clients into non-responders and potential responders and excellent responders | Comment on Facebook!
References:

Caffeine + Green Tea = Plus 10% Fat Oxidation & Energy Expenditure at Rest and During Sprint Interval Exercise

$
0
0
From a health perspective it may be good that green tea does not contain all-too much caffeine. From a fat loss perspective, it clearly lacks caffeine.
When it comes to dietary supplements, people like to pay tons of money for unproven ingredients with funky names and dubious or non-existent safety profiles; agents that have been scientifically proven to work, are safe and cheap, on the other hand, are non-sellers or at least considered to be non-effective.

Obviously, I cannot really explain why that is the case (I suspect it is because people effect drug-like effects without drug-like side-effects from supps and are thus always on the lookout for the "next big"... hoax), I can tell you, though, that a recent study that is going to be published in one of the upcoming issues of the Journal of Strength and Conditioning Research (Jo. 2015) shows that caffeine and green tea, two supplements that belong to the previously described category, are everything but useless.
You can learn more about coffee at the SuppVersity

For Caffeine, Timing Matters! 45 Min or More?

Coffee - The Good, Bad & Interesting

Three Cups of Coffee Keep Insulin At Bay

Caffeine's Effect on Testosterone, Estrogen & SHBG

The Coffee³ Ad- vantage: Fat loss, Appetite & Mood

Caffeine Resis- tance - Does It Even Exist?
In said study, Edward Jo and colleagues investigated the effects of a caffeine + green tea polyphenol mix (250mg caffeine + 400mg of a green tea extract with 50% EGCG and 5mg of caffeine per serving) on (a) metabolic rate and fat oxidation at rest, as well as following a bout of sprint interval exercise (SIE) and (b) the performance during a standardized sprint-interval test.

The study was a double-blind, randomized, placebo-controlled, crossover study that involvd 12 subjects (male: n=11; female:1 n=1) whose antroprometric data, i.e "body mass=76.1±2.2 kg; height= 169.8±1.6 cm; BMI= 22.7±3.0 kg/m2; body fat %= 21.6±2.0% [DXA data]" (Jo. 2015), already tell you that they were healthy recreationally active, but not necessarily athletic (it may be worth mentioning that they were relatively stim-naive with an intake of < 201mg of caffeine per day).
Figure 1: Energy expenditure (kcal/h) and fat oxidation (g/day) measure before (at rest) and during (during SIE) the sprint interval exercise 10 and 55 minutes after the ingestion of caffeine + GTE or placebo (Jo. 2015).
During the two testing sessions at the Human Performance Research Laboratory of the California State Polytechnic University, the subjects' resting energy expenditure (REE) was measured for 45 minutes starting 10 minutes after the ingestion of the aforementioned caffeine + polyphenol mix - a mix that was consumed on an empty stomach after an 8-h overnight fast (don't be fooled by the way the scientists report their data in "g/day" and kcal/day - I changed the latter, already but the values for fat in g would have become to small - we are talking about 45 + 30 min and a 24h measurement here).
Don't confuse increases in fat oxidation w/ fat loss: I guess we have to credit the supplement industry for propagating the myth that the ratio of fat to glucose you were burning was in anyway directly related to losing body fat. I am not sure how often I've written this on this blog or told someone in the gym: that is not the case. You can burn 20% more fat and still store more body fat if you increase your energy intake from exactly enough to already too much. The connection between fatty acid oxidation which would actually be a better term for the phenomenon we are talking about is complicated and a decreasing respiratory exchange ratio, i.e. a reduction of the ratio of glucose to fat that's used to fuel your metabolism is not a reliable predictor of fat loss.
After the initial 45-minutes, during which the subjects' resting energy expenditure had been measured, the subjects were placed on a computer-integrated cycle ergometer on which they performed a standardized 30 minute sprint interval exercise (SIE) protocol., the scientists describe as follows:
"Sprint-Interval Exercise Protocol. The SIE protocol was performed on the Velotron DynaFit Pro cycle ergometer and comprised of four 30-second maximal effort intervals each separated by 5 minutes of low-intensity, constant workload cycling (Figure 2). First, the ergometer was properly adjusted for the subject. Adjustment specifications for each subject was recorded during their familiarization visit and repeated for all experimental trials. Subjects initiated the SIE protocol with a 5-minute interval of low-intensity cycling at a constant workload of 75W. Immediately after, subjects cycled with maximal effort for 30 seconds against an added resistance that is 7.5% of BW for males and 7.2% for females. These two intervals were repeated three additional times. After the last 30-second sprint interval, the subjects performed an additional low-intensity 75W interval plus an extra 3 minutes of cool-down at a constant workload of 30W. The total duration of the SIE protocol was 30 minutes" (Jo. 2015).
A workout that had little effect on the effect of the caffeine + green tea combo which did, as you can see, when you compare the "at rest" and "during SIE" values in Figure 1, increase the energy at rest and during sprint interval training to a similar extent. More specifically, the increase in energy expenditure and fat oxidation was - within the margin of inter-individual variability - in the range of +10% during both conditions.

Figure 2: Illustration of the sprint interval exercise test performed 55 min after ingesting the supplement (Jo. 2015).
In view of the fact that we may safely assume that this effect should last for at least 2-3h this can be a practically relevant effect if it is complemented by a reduced energy intake and a caloric deficit. If the latter is not present, even the extremest increases in fat oxidation and energy expenditure will fizzle out and be as irrelevant as the effect of the caffeine + green tea combination on exercise average and peak power (W) during the sprint training, Jo et al. observed in their study... and "Yes!", that is disappointing, but in view of the low dose of caffeine and the non-existent effects of green tea on performance during a test like this not really surprising.
Did you know this SuppVersity Calssic? "Post-Workout Coffee Boosts Glycogen Repletion by Up to 30% and May Even Have Sign. Glucose Partitioning Effects | learn more!
Bottom line: I admit, they certainly sound less exciting as the latest exotic herb from the rain-forest or a substance that is listed only under its funky chemical name on the label, but unlike your average "innovative breakthrough metabolic activator" caffeine and green tea will deliver. The 10% increase in metabolic rate and the accompanying increase in fat oxidation won't make you lose slabs of body fat, but the effects are pronounced enough to expect a measurable effect on the success of your next diet / cut. A cut, by the way, that will still require a significant reduction in energy intake, even if your energy expenditure and fat oxidation. So, don't be a fool and confuse a 10% increase in fat oxidation w/ a 10% increase in fat loss that occurs in the absence of dieting on an ad-libitum diet | Comment!
References:
  • Jo et al. "Dietary Caffeine And Polyphenol Supplementation Enhances Overall Metabolic Rate And Lipid Oxidation At Rest And After A Bout Of Sprint Interval Exercise." Journal of Strength & Conditioning Research: Post Acceptance: November 23, 2015. doi: 10.1519/JSC.0000000000001277

Cacao, Delicious + Ergogenic - Performance Up and Muscle Damage Down After 7d on 21g/d of Hershey's 100% Cacao

$
0
0
Hershey's 100% Cacao, soon also available at your local GNC? If you look at the results of the study at hand, it does appear likely that a regular "food item" can compete with sign. more expensive sport supplements.
From previous SuppVersity articles you know that several studies have demonstrated the protective effects of cocoa consumption, due to its anti-inflammatory and antioxidant properties. From the news and my critical evaluations of the study results, you do yet also know that (a) regular chocolate lacks most of these beneficial effects and that the effects have (b) often been hilariously exaggerated in the laypress. Furthermore, studies that probe the efficacy of cacao or high cacao chocolate on exercise performance are, unlike studies on its anti-oxidant effects (e.g. Berry. 2010; Davison. 2012), something in-between "rare" and "quasi non-existent".

In spite of its relatively small size (fifteen 15-18 year old soccer players), a recent study González-Garrido et al's latest study that examined the effect of cocoa consumption on the markers of muscle damage, oxidative stress and physical fitness in professional soccer players, is thus still worth being discussed in the SuppVersity news.
You can learn more about chocolate and cacao at the SuppVersity

Chocolicious Statin 4 Women

Real Cacao Delicious + More

The Chocolate Diet for Women

Cacao for the Gut Microbiome

Cacao as Anti-Cancer "Drug"?

Don't Fall for Chocolate Myths
Furthermore, the fifteen players (15-18 years old) were part of a case-control study in which the which subjects acted as their own control - a means of making the results more significant in spite of a relatively low number of subjects.
Table 1: Nutritional profile of the cocoa "supplement", Hershey's 100% cacao powder (González-Garrido. 2015).
A study in which the researchers analyzed the biochemical parameters, markers of muscle damage and oxidative stress, and physical performance before and 24h after consuming 0.375 g/kg body mass of Hershey's 100% cacao powder in 300 mL water for 7 days.
Figure 1: Rel. changes (%) of markers of lipid and protein per-oxidation and anti-oxidant defenses (González-Garrido. 2015).
For the average study subject that was a dosage of roughly 25.1 g of cocoa per day - not exactly mass and certainly not enough to be afraid that the additional 162.5 kcal/day could have negative effects on your body composition, but obviously enough to trigger significant decreases in all the relevant markers of oxidative damage MDA + 4-HNE (lipid per-oxidation), carbonyl groups (protein per-oxidation), and improvements in all relevant markers of antioxidant defenses, i.e. GSH, TAC (increased) and thiols (decreased).
So what? Now the obvious question is: "Couldn't this impair the adaptation to exercise?" This question cannot be answered based on an acute response study, but with the acute increases in exercise performance (Cooper test, see Figure 2) and in spite of the significant reductions in CK and LDH (see Figure 2), which are usually interpreted as markers of muscle damage, this appears generally unlikely - yet not impossible.

Figure 2: Copper test (test of physical fitness | more) performance and creatine kinase (CK | more) and lactate dehydro- genase (LDH) levels after the 12-minute Cooper test before and after 7-days of supplementing with ~21g/d of 100% cacao powder (González-Garrido. 2015).
On the other hand, it is important to note that only the increased Cooper test performance (Figure 2), but none of the other markers has at least a non-significant predictive value with respect to the possible long-term effects on exercise performance - an effect that will have to be tested in future longer-term studies. A conclusion that would go beyond the scientists' statement that they "have shown the potential that cocoa consumption has on endurance performance and its role in recovery from muscle damage in athletes" (González-Garrido. 2015) would thus be unwarranted... as unwarranted as any speculations about the underlying mechanisms: yes, it is likely that the high polyphenol content of 100% cacao is what does the trick, but to prove that we'd need a low polyphenol chocolate control we don't have. If you want to benefit, though, I highly suggest to pick a 100% cacao powder with a low degree of processing | Comment!
References:
  • Berry, Narelle M., et al. "Impact of cocoa flavanol consumption on blood pressure responsiveness to exercise." British Journal of Nutrition 103.10 (2010): 1480-1484.
  • Davison, Glen, et al. "The effect of acute pre-exercise dark chocolate consumption on plasma antioxidant status, oxidative stress and immunoendocrine responses to prolonged exercise." European journal of nutrition 51.1 (2012): 69-79.
  • González-Garrido, et al. "An association of cocoa consumption with improved physical fitness and decreased muscle damage and oxidative stress in athletes." The Journal of Sports Medicine and Physical Fitness (2015): Epub ahead of pring Dec 02, 2015.

True or False? 'Low Fat' for the Lean, 'Low Carb' for the Obese and Insulin Resistant - Pilot Study Confirms Often Heard Dieting Advise on a Surface Level , However, ...

$
0
0
Low carb, or fat? Left or right?  Which one should you chose and why? Shall you go by your body weight, your insulin sensitivity or your personal food preferences?
"Low Fat for the Lean, Low Carb for the Obese and Insulin Resistant," this quote from the headline sounds like a reasonable advise if you look at the existing evidence on low carbohydrate dieting, which appears to excel whenever the subjects are significantly overweight and insulin resistant. Studies that would do a head-to-head comparison of the two to confirm the accuracy of the hypothesis that "because they are insulin resistant, avoiding carbohydrates will aid people with (pre-)diabetes in losing weight" are non-existent... well, I should probably say they "were" nonexistent; a recent pilot study by Gardner et al does after all just that: compare the weight loss response of insulin sensitive vs. resistant individuals who consume either a low fat or a low carbohydrate diet over 6 months.
You can learn more about improving your body composition at the SuppVersity

Long-Term Dieting Makes Gymnasts Fat!

Minimal Carb Reduction, Max. Results?
HIT Circuit + Plyos for Glucose Management

How Much Carbs Before Fat is Unhealthy?

5 Tips to Improve & Maintain Insulin Sensitivity

Weight Must be Lost Slowly? Busted!?
The results of Gardner's study have recently been published ahead of print in the venerable scientific journal  Obesity; and they are... interesting, but as it was to be expected for a pilot study with "only" 61 participants in four groups, more research will be needed to make definite conclusions.
Figure 1: Weight loss (kg) after 6 months on the respective in insulin resistant and sensitive subjects (Gardner. 2015).
If you look at the main study outcome, i.e. the weight loss in Figure 1, for example, it would appear as if the previously cited statement from the headline of today's SuppVersity article was confirmed. Due to the large intra-group (=between individuals in one group) differences in all four diet groups (see error bars in Figure 1, they are about as long as the mean difference, we may speak of a trend or a tendency, that appears to confirm the previously stated hypothesis that an insulin resistant individual is better off avoiding carbs when dieting while an insulin sensitive one should stick to the mainstream low-fat recommendations (remember all subjects were overweight, none of the was athletic).
Figure 2: Proportions of carbohydrates, fats, and proteins for each diet at baseline, 3 months, and 6 months (Gardner. 2015).
This wouldn't be a SuppVersity article, though, if a brief glimpse at the main result was everything it had to offer. Let's first take a look at the reported energy- and macronutrient intakes (Figure 2) of the healthy, premenopausal women and men (age 18-50) with stable (>2 months) BMIs and an age between 28 years and 40 years (aside from the increased number of subjects with metabolic syndrome in the insulin resistant group, there were no noteworthy inter-group differences at baseline).
Limbo-Titrate-Quality: The dietary strategy that was used is quite interesting and actually something worth copying for yourself or your clients. There was the "Limbo" phase where the fat or carb intake had to be cut back drastically to 20 g/day of total fat or digestible carbohydrates. The goal of this phase was, as the scientists point out "to achieve the lowest level of fat or carbohydrate intake within the first 8 weeks" (Gardner. 2015). In the second stage, the scientists labeled as the "Titrate" phase the subjects slowly added fat or carbohydrate back to their diet - in increments of 5 g/day (e.g., from 20 to 25 g/day). With each increase, the intake had to be maintained stable for at least 1, maximally 5 weeks before adding another 5 g/day. The (good) idea was to allow each of the participants (in what the researchers call stage 3 of the intervention, although 2 + 3 appear to depend on each other) to find his or her specific level of fat or carbohydrate intake he / sheh "could be maintained long term, potentially for the rest of their lives" (ibid). The fourth and last stage eventually focused on diet quality. In the "Quality" phase the subjects had to maximize the nutrient density of their foods by selecting whole foods, buying organic, grass-fed, etc.
As you can see significant inter-group differences were observed only for the macronutrient composition; and even though these differences were significant, we are nor talking about a ketogenic vs. no-fat diet. Rather than that, both diets had a relatively balanced macronutrient profile, albeit with different main energy sources (carbs vs. fat). What did not differ for the groups, though was the total energy intake (Figure 2). This is interesting, because, in theory, the subjects were allowed ot eat as much as they wanted; and still, the data in Figure 2 tells you that they restricted their energy intake by noteworthy 30% on average (the ~600kcal-deficit also explains why the subjects even lost weight), with no difference between the subjects on the allegedly more satiating low carb vs. low fat diet.
Figure 3: Fiber, added sugar and saturated fat intake in g/1000kcal (Gardner. 2015).
Visible differences existed, obviously, for the intake of fiber, added sugars and saturated fats (Figure 3). These differences, which are characteristic of low fat vs. low carb diets, may also be the reason a recent study by Mansoor et al. (see red box below) found differences in the effects on triglycerides (increases with high CHO and even more so sugar intake), HDL and LDL (both increase w/ high saturated fat intakes) when they compiled the results of the contemporary low fat vs. low carb trials.
So, what's healthier, then? Low carb or low fat? To answer this question, researchers from the University of Oslo have recently conducted a meta-analysis that yielded quite interesting results, when the individual findings from the studies were pooled as weighted mean difference (WMD) using a random effect model: Compared with participants on LF diets, participants on LC diets experienced a greater reduction in body weight (WMD –2·17 kg; 95 % CI –3·36, –0·99) and triglicerides (WMD –0·26 mmol/l; 95 % CI –0·37, –0·15), as well as a greater increase in HDL-cholesterol (WMD 0·14 mmol/l; 95 % CI 0·09, 0·19) - that's good. Unfortunately, they also saw signficant increases in LDL-cholesterol. With 0·16 mmol/l, the mean difference in LDL was larger than the mean HDL increase, which could suggest an increase in CVD risk and has the authors conclude that their "findings suggest that the beneficial changes of LC diets must be weighed against the possible detrimental effects of increased LDL-cholesterol" (Mansoor. 2015). Personally, I would say, though, that for the mostly obese subjects in the studies, the weight loss and reduction in triglycerides (likewise a marker of CVD risk) are more important than the increase in LDL-C - future studies should try to elucidate if the particle size and LDL oxidation worsened as well and what the actual long-term (years, not months) effects are.
It is thus no wonder that the data from  blood analysis of the study at hand (Figure 4) mirrors the results of the studies Mansoor et al. (2015) analyzed for their meta-analysis that is about to be published in the British Journal of Nutrition (see red box):
Figure 4: Changes in LDL-C, HDL-C, Trigs and fasting glucose after 3 & 6 months (Gardner. 2015).
With the most significant differences being observed for triglycerides and LDL, the situation is very similar to the one the Mansoor et al. describe in their review. In this regard, it is also worth mentioning that the differences between the groups were reduced, when the subjects started to increase their fat or carbohydrate intake by 5g on a 1-4 week basis to eventually end up at their individual "that's how I could eat for the rest of my life"-level (compare the 3 months with the 6 months data).

This doesn't solve the dilemma we're in, though: without further data on particle sizes and oxidative status of the LDL molecules, etc. it is virtually impossible to make a reliable prediction which of the two diets is going to have the higher long-term health benefits. What may be even more important, though, is that we must not forget that it is not debatable that both diets triggered significant weight loss and measurable health improvements, especially in the subjects with pre-existing insulin resistance (blue and orange bars in Figure 4).
Figure 5: Changes in the prevalence of metabolic syndrome after 3 and 6 months (Gardner. 2015).
Bottom Line: So, it doesn't matter how you diet as long as you diet? Well, as previously pointed out, the absolute weight-loss values in Figure 1 appear to confirm the hypothesis that "low carb" is for the sick, while "low fat" for the healthy overweight individuals.

The significant intra-group differences, however, tell us that whether you are or aren't insulin resistant is not the only determinant of your response to the different diets. Especially for healthy individuals experimentation and finding what suits you, your lifestyle and sports best does therefore still appear to be the way to go.

In those with pre-existing metabolic syndrome (which is more than just insulin resistance, by the way), the generally higher relative reduction in MetSyn prevalence Gardner et al. observed in their study (Figure 5) do yet appear to confirm the general trend towards low-carbohydrate diets for people with serious metabolic issue; and maybe that's actually the main take-home message of a study that must be seen as a first attempt to identify one of the variables that determine whether an individual thrives on a low carb, a low fat or maybe just a completely balanced diet | Comment!
References:
  • Gardner, et al. "Weight Loss on Low-Fat vs. Low-Carbohydrate Diets by Insulin Resistance Status Among Overweight Adults and Adults with Obesity: A Randomized Pilot Trial" Obesity (2015): Ahead of print.
  • Mansoor, et al. "Effects of low-carbohydrate diets v. low-fat diets on body weight and cardiovascular risk factors: a meta-analysis of randomised controlled trials." British Journal of Nutrition (2015): First view article.

Creatine and Bicarbonate - A Worthwhile Combination: Supplements Exert Great Individual and Small Combined Effects on HIIT Performance Test in Nine Well-Trained Men

$
0
0
The results of a Wingate test cannot be translated 1:1 to any sports.
You will probably remember my article about the combination of creatine and bicarbonate. Mixing both is basically what the producers of "buffered creatine" supplements do. Albeit with amounts of bicarbonate that may affect the uptake of the latter and offer benefits if you have to load as fast as possible, but won't have individual performance effects (learn more).

Other studies I've likewise covered in the SuppVersity Newsin the past showed both significant as well as borderline significant and non-significant beneficial effects of combining creatine and bicarbonate for a performance enhancing double-whammy in trained individuals.
You can learn more about bicarbonate and pH-buffers at the SuppVersity

The Hazards of Acidosis

Build Bigger Legs W/ Bicarbonate

HIIT it Hard W/ NaCHO3

Creatine + BA = Perfect Match

Bicarb Buffers Creatine

Bicarbonate Works for Most(!) Athletes
Against that background it is not surprising that a recent study by Griffen et al. (2015) found similarly ambiguous results. The study investigated the effects of creatine and sodium bicarbonate coingestion on mechanical power during repeated sprints. To this ends, nine well-trained men (age = 21.6 ± 0.9 yr, stature = 1.82 ± 0.05 m, body mass = 80.1 ± 12.8 kg) participated in a double-blind, placebo-controlled, counterbalanced, crossover study using six 10-s repeated Wingate tests.

Before each of the performance tests, the participants ingested either a placebo (0.5 g/kg of maltodextrin), 20 g/d of creatine monohydrate + placebo (Cre), 0.3 g/kg of sodium bicarbonate + placebo (Bi), or coingestion  (Cre + Bi) for 7 days, with a 7-day washout between conditions. Participants were randomized into two groups with a differential counterbalanced order. Creatine conditions were ordered first and last. The participants individual mechanical power output (W), total work (J) and fatigue index (W/s) were measured during each test and analyzed using the magnitude of differences between groups in relation to the smallest worthwhile change in performance.
Figure 1: Subject allocation.
Yes, the washout period could be a problem: With only nine participants you have to do crossover study, but in view of the results of previous studies (McKenna. 1999), which report washout times of 4 weeks, the scientists would have been on the safer side if they had planned for a washout of 28, not just 7 days. Now you may argue that not all subjects started "on" creatine, so that the residual effect could average out. The problem, however, is that the significance of the results of a study with only nine participants gets impaired with every subject who was in a creatine group before being randomly assigned to one of the placebo + X groups, so that the researchers would have had to order all the creatine conditions last, not one first and the other last, as it is depicted in Figure 1 and described in the full text of the study.
As the data in Figure 2 tells you, both, the creatine (effect size (ES) = 0.37–0.83) and sodium bicarbonate (ES = 0.22–0.46) supplementation, resulted in meaningful improvements of all three indices of mechanical power output compared to placebo. Now what we are really interested in, though, is what the combination of the two did...
  • In general, the coingestion provided "small meaningful improvements on indices of mechanical power output (W)" (Griffen. 2015) 
  • The previously mentioned advantage was yet only seen when comparing sodium bicarbonate (ES = 0.28–0.41) with the combination treatment; a similar beneficial effect was not seen compared to creatine alone
This does obviously mean that the addition of bicarbonate to creatine did not result in meaningful increases in power output in this particular exercise test.
Figure 2: The only relevant advantage of combining both creatine and bicarbonate was seen for the total work done (orange bars, see orange arrow); this however is also among the most relevant measures for real athletes (Griffin. 2015).
What it did do and that's what we actually take bicarbonate for is to "provided a small meaningful improvement in total work (J; ES = 0.24) compared with creatine" (Griffin. 2015) - or, in other words, anyone who does not just one, but several all-out sprints (and that's almost every athlete) will see a small but meaningful performance increase, one that may make the difference between victory and defeat (see Figure 1, orange bars).
The increase in PGC-1a expression you get if you do HIIT w/ sodium bicarbonate and the correspondingly increased stimulus for mitochondrial biogenenesis is a hitherto often overlooked benefit of "baking soda" supplementation | learn more
Disappointing? I would not say so, which significant improvements in response to both supplements and a potential "game changing" increase in the total work the subjects were able to perform on the cycle ergometer during the repeated Wingate tests, both supplements have proven their efficacy and the potential benefits of combining them. Benefits the Griffin et al rightly call "small", but "meaningful" in the conclusion to their recently published paper.

The fact that these benefits may not be as exorbitant as some of you may have hoped for does not imply that the combination of creatine and bicarbonate supplements is useless. In view of the overall small study size (low number of subjects even for a crossover study), the problem with the washout and the specificity of the exercise - who knows what the results in the gym or on a football field would have looked like, thus, future studies are warranted | Comment!
References:
  • Barber, James J., et al. "Effects of combined creatine and sodium bicarbonate supplementation on repeated sprint performance in trained men." The Journal of Strength & Conditioning Research 27.1 (2013): 252-258.
  • Griffen, C., et al. "Effects of Creatine and Sodium Bicarbonate Co-Ingestion on Multiple Indices of Mechanical Power Output During Repeated Wingate Tests in Trained Men." International Journal of Sport Nutrition and Exercise Metabolism, 2015, 25, 298-306.
  • McKenna, Michael J., et al. "Creatine supplementation increases muscle total creatine but not maximal intermittent exercise performance." Journal of Applied Physiology 87.6 (1999): 2244-2252.
Viewing all 1497 articles
Browse latest View live