Quantcast
Channel: SuppVersity - Nutrition and Exercise Science for Everyone
Viewing all 1497 articles
Browse latest View live

Explosive Reps May Pay Off - At Least on the Bench: Fast Reps = Higher Muscle Activity, Higher Volume... Gains?

$
0
0
Explosive training can, but it does not have to involve medicine balls and plyometric exercises. You can also do the regular bench press as fast as possible and will - as the study at hand says - achieve higher levels of muscle activity and an increase in rep volume.
You will probably have heard the acronyms EMG = electromyography and TUT = time under tension before, but did you know how they go together? The simple assumption that a higher time under tension would yield greater EMG values and thus higher muscle activations is - as a recent study confirmed, once more - as far from being correct as it is from being logical.

Think of it: It's simple physics. The force you apply is the product of the mass you move and the acceleration you exert on that mass. It's F = m · a - Force equals mass times acceleration. If you go slow to achieve a maximal time under tension, the acceleration will be low and so will be the force. Since my friends from the exercise physiological department tell me that F ~ EMG, meaning there's a in parts proportional increase in muscle activity when the force you applied increases, it should be obvious why the previously phrased hypothesis that "a higher time under tension would yield greater EMG" cannot be correct.
Regular and explosive RT can both be part of your periodization scheme!

30% More on the Big Three: Squat, DL, BP!

Block Periodization Done Right

Linear vs. Undulating Periodizationt

12% Body Fat in 12 Weeks W/ Periodizatoin

Detraining + Periodization - How to?

Tapering 101 - Learn How It's Done!
Unfortunately, things are not as simple as they may seem. After all, the activation patterns are reversed on the way down. Whut? Yes, they are. The slower you lower the weight (almost) onto your chest, the higher the negative acceleration you apply, ... and you know what that mean, right? YES! The greater the force.

So under physically ideal (no one says that this must be physiologically ideal, at this point!) conditions, you'd be exploding on your way up and going super-slow on your way down.

Unfortunately, this is not what any of the thirteen males, all of whom were familiar with the bench press exercise, did in the BA study by Gustav Mårtensson (2015 | still great work for a bachelor's thesis, by the way). What they did was to perform the bench press at their individual 6 RM with a tempo of either
  • 4 second per total repetitions, 6 second per total repetitions, or
  • each repetition intentionally performed as fast as possible (as Lawrence rightly points on on Facebook, that's not going to look much faster than normal speed with a 6-RM weight)
The subjects had been instructed to to perform the exercise to fatigue. So, next to the muscle activity which was recorded by the means of surface electromyography (EMG) on the pectoralis major and
deltoideus anterior, Mårtensson also counted the number of repetitions his subjects performed and recoreded the total time under tension for each test in seconds.
Figure 1: Normalized (rel. to maximal voluntary contractinos) EMG values (Mårtensson. 2015) - p < 0.05 for pecs, only.
To make sense of the (otherwise arbitrary) EMG values, Mårtensson had recorded a set of reference values using MVIC (Maximum voluntary isometric contraction) tests, beforehand. To put the data from the actual trial into perspective, the only thing he'd had to do was to express the newly recorded EMG data relative to these maxima - a procedure that yielded the results in Figure 1.
In this SV Classic you can learn about potential benefits of of combining va-rious training types: "Building the Jack-of-All-Traits Legs Workout With Squats, Jump Squats and Body Weight Plyo-metrics - This is it" | read more
What about long-term benefits? Unfortunately, the answer to this question is "very little". And while we know almost nothing about the comparative efficacy of regular vs. explosive training, we do have evidence that explosive training can increase rapid muscle force, strength and power in young athletes (Paavolainen. 1999), and even in old and very old normal people (Caserotti. 2008). Whether it would be smart to train only explosively, though, is questionable. Rather than that I'd suggest to use explosive workouts as part of your overall periodization schedule just like Newton et al. (1994) recommend it. Eventually it will yet always be goal-specific how much "explosive" and "regular" resistance training you will be doing.

Addendum: In a very recent study that has not yet been published Jenkins et al. found no link between increased muscle activation and size gains in a non-volume equated comparison of 80% and 30% 1-RM training (Jenkins. 2015). In view of the completely different training scenario and the considerable impact of differences in volume, metabolic byproduct accumulation, and muscle swelling, said study is yet probably of little relevance to the question at hand. 
As you can see, the results are not exactly as expected: YES, the fast tempo produces the highest, the low tempo the lowest muscle activation.  However, the authors found that "the difference was only statistically significant for pectoralis major" (Mårtensson. 2015) - a result that makes it difficult to tell whether "going fast will actually pay off".
Figure 2: Number of reps (indiv., left) + average (right) during the three BP conditions (Mårtensson. 2015)
The reason I still decided to put the line "explosive reps may pay off" into the headline is that the non-significantly enhanced muscle activity went hand in hand with a significantly increased rep-volume of 7.9 ± 3 reps in the fast vs. 6.0 ± 1 and 3.7 ± 1 reps in the medium and slow rep groups. In view of the fact that the same weight was used this would mean that the total volume was increased and the training stimulus should have been increased, as well - usually, that's reason enough, to assume that the outcome in terms of strength and size gains may benefit, no?
Root-mean-square amplitude (RMS amp.) before (initial) and after fatigue under varying speed-controlled conditions (slow, medium, and fast) and intensities (40–80% 1RM) for pectoralis major (a), anterior deltoid (b) and triceps medial head (c | Sakamoto. 2012)
But what are the real world implications? Yes, it would be haphazard to argue that the study at hand would "prove" the superiority of explosive training. Specifically in view of the fact that previous studies focusing on the same outcomes yielded similarly small differences in muscle activities (Sakamoto. 2012, see figure to the right). It is thus, as Mårtensson writes "difficult to decide if it has an actual impact on strength and hypertrophy adap- tations from resistance training" (Mårtensson. 2015).

This is particularly relevant, since the high(er) EMG levels alone can't tell us if the number of muscle fibers that were activated increased or if their indiv. contractile force increased. In view of the increased rep volume at (obviously) not decreased "rep quality" (=muscle activity) I would still support Mårtensson's conclusion that eventually, his study suggest that there appear "to be benefits of using faster lifting speeds compared to intentionally performing an exercise slowly" (Mårtensson. 2015). Next to a long-term study to confirm that the "advantage" pays off in form of increased strength and size gains, I would also like to see data on the use of the most promising rep scheme with fast concentrics (explode on your way up) and slow eccentrics (go slow on your way down) on the bench | Comment on Facebook!
References:
  • Caserotti, Paolo, et al. "Explosive heavy‐resistance training in old and very old adults: changes in rapid muscle force, strength and power." Scandinavian journal of medicine & science in sports 18.6 (2008): 773-782.
  • Jenkins ND1, Housh TJ, Bergstrom HC, Cochrane KC, Hill EC, Smith CM, Johnson GO, Schmidt RJ, Cramer JT. "Muscle activation during three sets to failure at 80 vs. 30 % 1RM resistance exercise." Eur J Appl Physiol. 2015 Jul 10. [Epub ahead of print]
  • Mårtensson, Gustav. "The effect of lifting speed on factors related to resistance training: A study on muscle activity, amount of repetitions performed, and time under tension during bench press in young males." (2015).
  • McGuigan, Michael R., et al. "Effect of explosive resistance training on titin and myosin heavy chain isoforms in trained subjects." The Journal of Strength & Conditioning Research 17.4 (2003): 645-651.
  • Newton, Robert U., and William J. Kraemer. "Developing Explosive Muscular Power: Implications for a Mixed Methods Training Strategy." Strength & Conditioning Journal 16.5 (1994): 20-31.
  • Paavolainen, Leena, et al. "Explosive-strength training improves 5-km running time by improving running economy and muscle power." Journal of applied physiology 86.5 (1999): 1527-1533.
  • Sakamoto, Akihiro, and Peter J. Sinclair. "Effect of movement velocity on the relationship between training load and the number of repetitions of bench press." The Journal of Strength & Conditioning Research 20.3 (2006): 523-527.
  • Sakamoto, Akihiro, and Peter James Sinclair. "Muscle activations under varying lifting speeds and intensities during bench press." European journal of applied physiology 112.3 (2012): 1015-1025.
  • Santos, Eduardo JAM, and Manuel AAS Janeira. "Effects of complex training on explosive strength in adolescent male basketball players." The Journal of Strength & Conditioning Research 22.3 (2008): 903-909.

Nausea, Leaky-Gut & GI Disturbances - Ginger Ameliorates All | May Be the Perfect Addition to Your Workout Nutrition

$
0
0
You will find dozens of ginger + lemon water recipes on the internet - all of them can pimp your peri-workout drinks and make your tummies "exercise proof".
As a regular here at the SuppVersity you know about the beneficial health effects of ginger. It has potent anti-oxidant and anti-inflammatory effects without the usual side-effects of COX-inhibitors (Mashhadi. 2013), has been shown to have anti-cancer effect on it's own (Kim. 2005), as well as to be a perfect adjunct for conventional cancer therapy (Sontakke. 2003).

Ginger has also been shown to exert cardioprotective effects (Ghayur. 2005; Singletary. 2010), strengthens the immune system (Butt. 2011) and significant beneficial effects on the health of the digestive system - including the make-up of your microbiome (Sutherland. 2009).
One thing that should be in your peri-workout (best post-workout) regimen is creatine 

Creatine Doubles 'Ur GainZ!

Creatine, DHT & Broscience

Creatine Better After Workout

More Creatine PWO Evidence

Creatine Blunts Fat Loss?

Build Your Own Buffered Creatine
Now, it is out of question almost all of these effects would be beneficial to athletes, too. The one I want to focus on, today, though, is directly related to the last-mentioned effect: the beneficial effect on the gut. It is well-known that athletes, in general, and endurance athletes, in particular, are having a hard time keeping their tummy from "leaking" (learn more about the link between exercise and leaky gut). With ginger - that's at least what a recent study from the School of Life Sciences at the Heriot-Watt University in Edinburgh suggests. The scientists went from the observations that
  1. the frequency of upper and lower gastrointestinal disturbance as a function of exercise is reported to be between 30 and 70%
  2. the severity of symptoms ranging from mild stomach discomfort to severe diarrhoea and 
  3. the consumption of beverages either before or during exercise may increase the incidence rate by over 25%
to the hypothesis that spiking said beverages with an agent that has previously been shown to reduce the symptoms of nausea and vomiting could be of great benefit for athletes.
Addendum: Are there pesticides in ginger? Oliver Klettner wants to know if there's a risk that you're intoxicating yourself with ginger. Unfortunately, the data on this subject is scarce. According to an older study in the Journal of Agricultural and Food Chemistry, ginger is yet one of the imported spices that contain relatively little DDT, PCB, Dieldrin, Endrin and BHC residues. The ginger from Nigeria in particular has almost no DDT and BHC, while the products from India contained measurable, but probably uncritical amounts (Sullivan. 1980). Similar and even lower levels were detected more recently by Srivastava et al. (2001) in important ginger powder from India. Data on Chinese ginger, which is what Oliver asked about, in particular, is not available in the literature. What is available, though, is data on commercial ginger powders sold in Germany in the late 1970s. The products of undisclosed origin Boppel (1979) tested contained both lead and cadmium, albeit in low doses (1.9 parts per million and 0.35 ppm). Also, in view of the epidemiological evidence in favor of the health benefits of ginger, it appears rather unlikely that (probably existing) pesticide and heavy-metal residues are a general problem. The average ginger consumer is after all ingesting it with a certain amount of these compounds. If that was a sign. health problem, the health benefits should not exist.
In the present study, this agent was ginger that was added to an isotonic beverage 40 recreational athletes (23 male, 17 female) who had volunteered to participate in the study consumed on one out of three test drinks containing 450 ml of either water or beverage A or beverage B in two 225ml servings before and after their workout:
  • Study Underlines Real World Benefits of 2g/day of Ginger for Type II Diabetics - Effects Almost on Par W/ Metformin | more
    Beverage A contained 7·5% glucose, 10 mM NaCl, citric acid, K sorbate and 62·5 ml of ginger root extract per 1 L.
  • Beverage B was identical to beverage A but the ginger was replaced with 62·5 ml of carrot extract. 
  • The control drink contained nothing but plain water.
During each of the three sessions the volunteers completed a 5 km run around the same course. To minimize unwanted interferences due to the test-drinks or fatigue, the sessions were spaced at least 7 days apart (and the subjects were asked not to change training or lifestyle during the study period).
What's the mechanism behind the exercise induced gastrointestinal disturbances? With exercise it's the reduction in gastrointestinal integrity that's driving the increase in gastrointestinal symptoms. Studies show, the harder you exercise, the more the gut integrity suffers and the more susceptible you become to intestinal disturbances. It's not clear how exactly ginger protects your gut from becoming leaky, but it would appear to be most likely that it's a result of its potent anti-inflammatory effects.
The same 5 item questionnaire that has been successfully used Pfeiffer et al. to probe the effects on nutritional intake on gastrointestinal problems during competitive endurance events in 2012 was used to assess the upper and lower gastrointestinal (GI) symptoms before and after exercise. In said test, the subjects hat to place a mark a 10 cm line to rate the severity / occurrence of symptoms anywhere between 0 (low / never) and 10 (high  / always). 
"Section 1 addressed upper abdominal problems (reflux / heartburn, belching, bloating, stomach cramps/pain, nausea, vomiting); section 2 addressed lower abdominal problems (intestinal/lower abdominal cramps, flatulence, urge to defecate, side ache/stitch, loose stool, diarrhea, intestinal bleeding); and section 3 addressed systemic problems (dizziness, headache, muscle cramp, urge to urinate)" (Pfeiffer. 2012). 
The evaluation of the showed a significnat increase in the incidence of upper GI disturbance (P < 0·05) in response to exercise; stomach problems increased from pre-exercise 1.7 (0.1–6.3) to 2.0 (0.1–8.4) during exercise and nausea increased from pre-exercise 1.1 (0.1–4.5) to 2.0 (01–7.6) during exercise. 
Figure 1: The addition of the ginger root extrac lead to a sign. amelioration of the almost 200% increase of the incidence of gastrointestinal symptoms in the 40 recreational athletes who participated in the study (Ball. 2015).
All other measures of GI disturbance were similar between pre-during and post-exercise and the general consumption of beverages did not exacerbate the GI symptoms during exercise. 

What the ginger containing beverage did, however, was that it reduced the prevalence of stomach problems (4.6 (0.3–6.6)) and nausea (4.5 (0.3–9) decreased significantly (P < 0.05) - an effect that was not observed with either beverage B or water, which were without noticeable effects on stomach problems (5 (0.2–8.2)) and nausea (5 (0.2–7)).  
Bottom line: Overall, the data from the study at hand is the first piece to a puzzle of evidence that could eventually prove the usefulness of ginger as a functional ingredient in pre- and post-workout beverages for endurance athletes - even if it does only ameliorate, not block the dramatic (>100%) increase in gastrointestinal problems.

Ginger is also on the list of supps in this SV Classic: "Supplements to Improve & Restore Insulin Sensitivity - Installment #4" | more
What is still missing, though, are (a) long(er) term studies in larger study populations, (b) evidence that the benefits occur in (1) higher-intensity exercise / longer duration exercise (I am thinking along the lines of Ironman training) and (2) anaerobic exercises like resistance training or sprinting which are similar prone to inducing (temporal) gastrointestinal problems and last but not least (c) insights into the mechanism(s) behind the beneficial effect of ginger - effects of which Ball et al. (2015) speculate that they may be, linked to the antagonist effects on serontonergic 5HT receptors, as they have been suggested by Sontakke et al. in a chemotherapy study (2003) | Comment on Facebook!
References:
  • Ball, D., G. Ashley, and H. Stradling. "Exercise-induced gastrointestinal disturbances: potential amelioration with a ginger containing beverage." Proceedings of the Nutrition Society 74.OCE3 (2015): E186.
  • Boppel, B. "[Lead-and cadmium-content of foodstuffs 1. Lead-and Cadmium-content of spices and table salt (author's transl)]." Zeitschrift Fur Lebensmittel-Untersuchung Und-Forschung 160.3 (1975): 299-302.
  • Butt, Masood Sadiq, and M. Tauseef Sultan. "Ginger and its health claims: molecular aspects." Critical reviews in food science and nutrition 51.5 (2011): 383-393.
  • Ghayur, Muhammad Nabeel, and Anwarul Hassan Gilani. "Ginger lowers blood pressure through blockade of voltage-dependent calcium channels." Journal of cardiovascular pharmacology 45.1 (2005): 74-80.
  • Kim, Eok-Cheon, et al. "[6]-Gingerol, a pungent ingredient of ginger, inhibits angiogenesis in vitro and in vivo." Biochemical and biophysical research communications 335.2 (2005): 300-308.
  • Mashhadi, Nafiseh Shokri, et al. "Anti-oxidative and anti-inflammatory effects of ginger in health and physical activity: review of current evidence." International journal of preventive medicine 4.Suppl 1 (2013): S36.
  • Singletary, Keith. "Ginger: An Overview of health benefits." Nutrition Today 45.4 (2010): 171-183.
  • Sontakke, S., V. Thawani, and M. S. Naik. "Ginger as an antiemetic in nausea and vomiting induced by chemotherapy: a randomized, cross-over, double blind study." Indian journal of pharmacology 35.1 (2003): 32-36.
  • Srivastava, L. P., Roli Budhwar, and R. B. Raizada. "Organochlorine pesticide residues in Indian spices." Bulletin of environmental contamination and toxicology 67.6 (2001): 856-862.
  • Sullivan, James H. "Pesticide residues in imported spices. A survey for chlorinated hydrocarbons." Journal of agricultural and food chemistry 28.5 (1980): 1031-1034.

Three Days on Pasta, Muffin & Bread Diet (84% CHO) = 1kg Add. Lean Mass and a Sign. Trend for Decreased Fat Mass

$
0
0
Bodybuilders use carb-ups to look more muscular with a good reason.
Dual-energy X-ray Absorptiometry aka DEXA or DXA is the gold-standard for measuring one's body composition in both scientific studies and real-world scenarios like monitoring the training response in professional athletes.

Compared to other techniques such as body impedance analyses and the skin-fold method, which are highly susceptible to changes in the water balance and the expertise of the person taking the measurements, respectively, DXA data is considered a more reliable method to assess lean body mass (LBM) and body fat percentage in clinical research and athletic practice.
Taurine& other agents that affect cellular hydration may fool DXA scans, as well

Taurine Pumps Up Strength & Recovery?

Taurine Improves Insulin + Glucose Metabolism

Taurine ➲ 180% Testosterone Increase

Taurine + BCAA Work Hand in Hand

43% Reduced Performance W/ BCAAs

BCAA Neurotransmitter Depletion
DXA is also one of the few technologies that can allegedly reliably determine total and segmental (i.e. trunk, leg and arm fat mass and LBM) body composition, a feature you should keep in mind, because it will be relevant to the evaluation of a recent study from the Université du Québec à Montréal (Rouillier. 2015), which found increases particularly in the legs, yet not in the trunk musculature. Irrespective of the location of the gains, it's a study that puts a question-mark behind the reliability of DXA data certain, not exactly uncommon scenarios.

It is common knowledge that the LBM values you get with DXA represent water, glycogen, proteins and minerals in the lean muscle. In view of the fact that the amount of water in muscle increases with each gram of glycogen that's stored (rule of thumb: 4g of water per 1g of glycogen), scientists have thus long speculated that significant changes in muscle glycogen and the subsequent increases in water may thwart the results you get when you access your own or your subjects's body composition by the means of DXA. Since the muscle glycogen concentrations and water content could markedly change in humans, during very short, acute phases of high-carbohydrate intakes, Pietrobelli et el. advocated research on the impact of changing muscle glycogen levels on body composition measurements, using DXA as early as in 1996 (Pietrobelli. 2015) - research that has not been done in the past ~20 years, though, until... well, until Rouillier et al. took care of it.
Study results w/ important implications for researchers: As Rouillier et al. point out, future studies will probably have to make up for the glyocogen-induced errors by using "a standard preparatory diet for all participants before performing a DXA scan". That carb-depriving or -loading subjects at the end of - let's say - a low carb vs high-carb study, may produce its own problems such as an increased glycogen super-compensation in the low- vs. high carbohydrate group, is yet an issue that's not addressed by the Canadian scientists. Eventually it may thus be necessary to develop a method to correlate DXA values with likewise measured glycogen levels in the muscle and liver to acquire 100% reliable results.
In their study, twenty non-obese young men (age 22.7 ± 2.6 years, BMI 23.5 ± 2.1 kg/m²) were subjected to two DXA tests. One before and after another one after being fed a high-carbohydrate diet for 3 days.
Post-Workout Glycogen Repletion - The Role of Protein, Leucine, Phenylalanine and Insulin. Plus: Protein & Carbs How Much do You Actually Need After a Workout? Learn more in this SV Classic!
"All participants followed a high-carbohydrate diet ( ≥ 75% of total kilocalories consumed from carbohydrates) for 3 days. Examples of detailed high-carbohydrate meals for the day as well as examples of foods high in carbohydrates, which included the amount of carbohydrate for each food in grams, were given to each subject based on their total energy expenditure.

Examples of foods that were recommended to the participants were pasta, cereals, rice, bread, muffins, potatoes, corn, juices and fruits. Participants were allowed to eat carbohydrate rich foods of their choice and no restrictions were given. It should be noted that each participant was instructed not to perform any strenuous exercises during the 3 days of energy expenditure estimation before the diet started and 3 days during the diet" (Rouillier. 2015)
To ensure that the subjects did not mess up the results by non-adherence, the participants completed a food diary during the 3-day high-carbohydrate diet to determine the mean percentage of carbohydrates consumed from total kilocalories. In that, the participants were asked to write as much information as possible about the foods they ate (i.e. brand names, percentage of carbohydrates, fats and proteins, how the food was cooked, etc.).
Figure 1: Let's be honest, you don't really believe that the subjects gained 5% substantial lean mass in the legs within just 3 days due to eating pasta, muffins and fruits, do you? No, well Rouillier et al. (2015) don't believe that either. Rather than that, they interpret their results as evidence in favor of the hypothesis that ignoring the glycogen levels makes DXA useless.
While the dietary adherence was, just as you'd expect it with a "muffins, cereals and pasta"-diet, high, the accuracy of the post DXA-test the scientists did was hilariously low. After all, it is quite unlikely that the young normal-weight men gained significant amounts of total and appendicular lean body mass after only three days on a 83.7 ± 8.4% high-carbohydrate diet (p < 0.01). What's even more unrealistic, though, is that they did that in the presence of a "strong tendency for lower body fat percentage values after the intervention (p = 0.05)" (Rouillier. 2015) - right?
Taking the stairs instead of the elevator, using the bike instead of the car and other means to increase your regular daily physical activity may be similarly effective as three workouts per week for you or overweight clients who cut their energy intake to lose fat and build muscle mass | more
Bottom line: Yes, today's article may be most relevant for researchers who better keep in mind that "the effect of an acute high carbohydrate diet seems to affect body composition values
using DXA, such as total LBM" (Rouillier. 2015). For them this study indicates that there's a great need for standardized diets prior to using DXA to avoid measuring "gains", or improvements (on high carbohydrate) and deteriorations (on low carbohydrate diets) in body composition that actually don't exist.

With that being said, the results of the study at hand do also confirm the common practice of carbohydrate loading in bodybuilders and fitness competitors who will - as the data in the study at hand shows - look objectively more muscular after a high CHO refeed | Comment on Facebook!
References:
  • Pietrobelli, Angelo, et al. "Dual-energy X-ray absorptiometry body composition model: review of physical concepts." American Journal of Physiology-Endocrinology And Metabolism 271.6 (1996): E941-E951.
  • Rouillier, M-A., et al. "Effect of an Acute High Carbohydrate Diet on Body Composition Using DXA in Young Men." Annals of Nutrition and Metabolism 66.4 (2015): 233-236.

Casein-Hydrolysate Beats Whey as Intra-Workout Protein: Faster Time-Trial Times vs. Water, Non-Sign. Performance Boosts Compared to CHO, Whey & Whey + CHO Beverage

$
0
0
Whey or casein hydrolysate - or rather no protein - what to use in your intra-workout beverage for endurance?
Last week, SuppVersity reader Oscar Qiu asked me which protein supplements I would suggest he'd buy. My answer was simple: "Get a cheap whey protein and if you want to spend extra money, add some micellar casein. Dose it at a ratio of 20:10 whey:casein post-workout (learn why) and, if you feel you're not getting enough protein on a daily basis, optionally, take them at a ratio of 10:20 whey:casein right before bed" (learn more about pre-bed casein).

Now, I am not going to revise this basic supplementation advice I gave based on the results of a recent study from the University of the Witwatersrand (Oosthuyse. 2015), but it may still be worth considering that other protein sources like whey-hydrolysate (learn more) or, as in this case, casein-hydrolysate may have certain context-specific benefits over the aforementioned "staple proteins".
You can learn more about dairy at the SuppVersity

Dairy Has Branched-Chain Fatty Acids!

Is There Sth. Like a Dairy Weight Loss Miracle?

There is Good A2 and Bad A1 Dairy, True or False?

Lactulose For Your Gut & Overall Health

Milk Boosts Glucose Uptake

Whey + Casein = Optimal PWO Nutrition
In said study, Oosthuyse et al. tried to find the "protein most suitable for ingestion during endurance exercise" (Oosthuyse . 2015). To this ends, the researchers compared the effects of co-ingesting either
  • 15 g/h whey-hydrolysate with (whey-CHO) or without carbohydrates (whey-PLA) or
  • 15 g/h casein-hydrolysate with (casein-CHO) or without carbohydrates (casein-PLA).
In conjunction with the placebo, only, and the carbohydrate, only, trials there are six trials, i.e. placebo, placebo+whey, placebo+casein, the 63g/h fructose: maltodextrin (0.8:1) that made up the CHO content of the test beverages, alone, and in conjunction with either whey or casein-hydrolysates.
Table 1 + 2: Dietary records (mean ± SD) for 2 days preceding the day of each experimental trial (left); composition of the experimental beverages consumed during the trials (right | Oosthuyse. 2015).
Practically speaking this meant that 2h after the last meal (postprandial), 8 male cyclists ingested either: carbohydrate-only, carbohydrate-whey-hydrolysate, carbohydrate-casein-hydrolysate or placebo-water in a crossover, double-blind design during 2 h of exercise at 60 %Wmax followed by a 16-km time trial.
Why would you even want to consume protein during endurance exercises? As the authors point out, the mechanisms by which protein supplementation during exercise may potentiate endurance performance are (1)providing additional oxidative, gluconeogenic and anaplerotic substrate, (2) reducing endogenous protein catabolism (Korach-Andre. 2002; Koopman. 2004), (3) reducing exercise-induced muscle damage (Saunders. 2005, 2007 & 2009), (4) improving rehydration (Seifert. 2006) and (b) possibly delaying central fatigue (Skillen. 2008). While all of these potential mechanism are backed up by isolated studies, the results are far from being unambiguous with conflicting evidence being presented in several studies and reviews (Cermak. 2009; Breen. 2010; Hobson. 2015). The study at hand does however add a new perspective to the research by evaluated whether the addition of protein to a carbohydrate energy drink will affect exercise metabolism and specifically the rate of oxidation of the co-ingested carbohydrate, as well as using different forms of protein. With whey and whey hydrolysate being the predominantly used forms of protein in previous studies, it is thus well possible that the conflicting evidence would have been less conflicting if all studies had used casein hydrolysate instead.
Data were evaluated by magnitude-based inferential statistics and revealed only non-significant effects on carbohydrate oxidation, measured from 13CO2 breath enrichment, by either of the two protein hydrolysate in isolation (data not shown),
Figure 1: What really counts are the performance improvements (left) and potential gastrointestinal side effects during (right, c), yet not so much right after the time-trial (right, b | Oosthuyse. 2015).
This changed, when the carbohydrates came into play: While the increased carbohydrate availability obviously lead to increases in glucose oxidation in all trials, these increases were substantially decreased (98% very likely decrease) when the carbohdrate drink was co-ingested with casein-hydrolysate (mean ±SD, 242 ±44; 258±47; 277 ±33g for carbohydrate-casein, carbohydrate-whey and carbohydrate-only, respectively). As it was to be expected, this decrease in carbohydrate oxidation during exercise had to be compensated by increases in fat oxidation - in this case a 93% likely increase from 83 ±27 and 73 in the whey-carbohydrate and carbohydrate-only to 92 ±14 g in the casein-hydrolysate group.

Figure 2:  Hydro whey and hydro casein have only slightly different amino acid makeups - *indicates essential amino acids (Oosthuyse. 2015).
Now, some people who are still believing in the long-overcome theory of exercise-induced fat loss may speculate that the increased fatty oxidation in the casein group would indicate that the co-ingestion of casein-hydrolysate would increase exercise-induced fat loss. You, as a SuppVersity reader know that the assumption that increased intra-workout fat oxidation would equal increased fat loss is total bogus. Accordingly, you will appreciate that the addition of casein to the intra-workout equation did have additional, practically relevant benefits: It lead to a significantly faster time trial ( − 3.6%; 90 % CI: ±3.2%) performances compared to placebo-water (95 % likely benefit).

Ok, now that you've hopefully memorized that you can safely ignore the non-existent fat-loss benefits of increased fat oxidation during exercise (assuming it is just to compensate a reduced CHO oxidation, as in this case), you must be careful not to jump to the similarly unwarranted conclusion that the time-trail times in Figure 1 would indicate that you or the (endurance) athletes you may be coaching should exchange all their "Gatorades" and other CHO-based intra-workout beverages for pure casein-hydrolysates.
Tired, exhausted, had to cut your workout short today? Is it the flu, or just too much BCAAs?
Don't flush all your Gatorade down the toilette, ... yet: For one, there are still issues with bloating and thirst during, as well as intestinal cramps after the workouts when you co-ingest protein and carbohydrates. More importantly, however, the performance increase the researchers saw with in the casein-hydrolysate trial reached statistical significance only in comparison to the water-placebo trial. The benefits were non-signifcant, even when casein was compared to carbohydrates, only. This does not negate that the study at hand suggest that you should prefer hydrolyzed casein over whey-hydrolysate as an intra-workout protein source. What the study certainly does not tell you, thouh, is that all athletes should replace their carbohydrate containing intra-workout beverages with water + casein-hydrolysate - even if the contemporary carbohydrate scare may make this non-alternative appealing.

Before making a final statement about "the optimal intra-workout protein source", it would also be necessary to know exactly what's responsible for the advantage - it could be the higer amount of glutamine in casein vs. whey, which could help curb the increase in ammonia during high intensity exercise (Bassini-Cameron. 2008) - a problem due to which consuming large amounts of BCAA supplements during exercise may actually do the opposite of what the shiny ads will tell you. It could yet also be any other difference in the amino acid make-up, the absorption kinetics or the peptide structure of whey- vs. casein-hydrolysates that explains the difference | Comment on Facebook!
References:
  • Bassini-Cameron, Adriana, et al. "Glutamine protects against increases in blood ammonia in football players in an exercise intensity-dependent way." British journal of sports medicine 42.4 (2008): 260-266.
  • Breen, Leigh, Kevin D. Tipton, and Asker E. Jeukendrup. "No effect of carbohydrate-protein on cycling performance and indices of recovery." Med Sci Sports Exerc 42.6 (2010): 1140-1148.
  • Cermak, Naomi M., et al. "Muscle metabolism during exercise with carbohydrate or protein-carbohydrate ingestion." Medicine and science in sports and exercise 41.12 (2009): 2158-2164.
  • Hobson, Ruth, and Lewis James. "The addition of whey protein to a carbohydrate–electrolyte drink does not influence post-exercise rehydration." Journal of sports sciences 33.1 (2015): 77-84.
  • Koopman, René, et al. "Combined ingestion of protein and carbohydrate improves protein balance during ultra-endurance exercise." American Journal of Physiology-Endocrinology and Metabolism 287.4 (2004): E712-E720.
  • Korach-Andre, Marion, et al. "Differential metabolic fate of the carbon skeleton and amino-N of [13C] alanine and [15N] alanine ingested during prolonged exercise." Journal of Applied Physiology 93.2 (2002): 499-504.
  • Oosthuyse, T., M. Carstens, and A. M. Millen. "Whey or Casein Hydrolysate with Carbohydrate for Metabolism and Performance in Cycling." International journal of sports medicine (2015).
  • Saunders, Michael J., Mark D. Kane, and M. Kent Todd. "Effects of a carbohydrate-protein beverage on cycling endurance and muscle damage." MEDICINE AND SCIENCE IN SPORTS AND EXERCISE. 36.7 (2004): 1233-1238.
  • Saunders, Michael J., Nicholas D. Luden, and Jeffrey E. Herrick. "Consumption of an oral carbohydrate-protein gel improves cycling endurance and prevents postexercise muscle damage." The Journal of Strength & Conditioning Research 21.3 (2007): 678-684.
  • Saunders, Michael J., et al. "Carbohydrate and protein hydrolysate coingestion's improvement of late-exercise time-trial performance." International journal of sport nutrition 19.2 (2009): 136.
  • Seifert, John, Joseph Harmon, and Patty DeClercq. "Protein added to a sports drink improves fluid retention." International journal of sport nutrition and exercise metabolism 16.4 (2006): 420.
  • Skillen, Rebecca A., et al. "Effects of an amino acid-carbohydrate drink on exercise performance after consecutive-day exercise bouts." International journal of sport nutrition 18.5 (2008): 473.

Using Ice / Cold Water Immersion After Workouts Will Impair Muscle and Strength Gains, as well as Vascular Adaptations

$
0
0
4x fail - if you look at the latest cold-water immersion science.
There are proven acute regenerative benefits of both cold water immersion and cold / ice application after exercise... cool? Not so cool, no. Two recent studies demonstrate: In the long run both will impair your gains.

The studies from Japan (Yamane. 2015) and Norway + Australia (Roberts. 2015) were conducted independently and published almost simultaneously in the International Journal of Sports Medicine and the Journal of Physiology, respectively. Therefore, I'd like to discuss them one after the other, before I finally tie the knots between the studies in a conclusion some of you are not going to like.
Learn more about hormesis and how antioxidants can also impair your gains

Is Vitamin E Good for the Sedentary Slob, Only?

NAC Impairs Anabolic Effects of Exercise

If Vitamin C is Low, Taking More is Good

C+E Useless or Detrimental for Healthy People

Vitamin C and Glucose Management?

Antiox. & Health Benefits Don't Correlate
"Does Regular Post-exercise Cold Application Attenuate Trained Muscle Adaptation?" that's not only the title, but also the central question in a recent study by Yamane et al. (2015). In the corresponding experiment, 14 male subjects did 5 sets of 8 wrist-flexion exercises at workloads of 70–80% of the single repetition maximum, 3 times a week for 6 weeks. Of the total of 14 male subjects,
  • 7 subjects immersed their experimental forearms in cold water (10± 1°C) for 20min after wrist-flexion exercises (cooled group), while
  • the other 7 who served as control subjects (noncooled group) refrained from putting their forearms into the 10°C cold water
At the end of the 6-week training period, the wrist-flexor thickness, brachial-artery diameter, maximal muscle strength, and local muscle endurance were measured in upper extremities.
Figure 1: Rel. changes (%) of forearm diameter (muscle size), muscle strength (of the wrist flexors), brachial-artery diameter (vascular adapation) and local muscle endurance (Yamane. 2015).
The results in Figure 1 may come as a nasty surprise to some of you: The wrist-flexor thicknesses of the experimental arms increased after training in both groups, but the extent of each increase was significantly less in the cooled group compared with the non-cooled group.

That this is not a question of post-exercising swelling, only, can be inferred from the fact that the maximal muscle strength and brachial-artery diameter did not increase in the cooled group, either. That's much in contrast to the non-cooled group where both variables as well as the local muscle endurance increased significantly. If we assume that similar effects occur for other muscle parts, it would thus not be a good idea to join Peer Mertesacker in the ice-tub that made him world-famous after the quarter-finals of the soccer world cup, last year.
The satellite cell activity of which SV readers know that it is drive - at least partly - by the inflammatory response to exercise is blunted in the cold water immersion (CWI) vs. active recovery (ACT) trial (Roberts. 2015).
What's the reason the treatments have different acute vs. long-term effects? As usual, the answer to this question is hormesis. Luckily, Roberts et al. did what it takes to provide insights into the possible mechanism in second study in which they investigated the acute effects of active recovery and cooling on a handful of parameters that are highly relevant for the chronic adaptations to resistance training  (see study 2, below) . Among those were the satellite cell activity and the phosphorylation of the protein synthesis motor p70S6-kinase, both of which were significantly more pronounced in the active recovery vs. cold immersion trial. The IL-6 and VEGF response which was measured in the Yamane study, on the other hand, did not differ significantly. In view of the fact that cooling attenuated the acute changes in satellite cell numbers and activity of kinases that regulate muscle hypertrophy, it is still likely that what we are dealing with, here, is another instance of a blunted hormetic response to exercise-induced stress.
Now, with just one study investigating only one muscle group, you may well argue that this could be an outlier and eventually it's thus not a problem or even beneficial if you use cold water application or cold water immersion after every workout.

If we add the results Llion A. Roberts et al. present in their accepted article in the The Journal of Physiology, however, it does no longer look like any of the findings were coincidental. After all, Roberts et al. conducted not one but two studies to investigate whether and why "regular cold water immersion influences muscle adaptations to strength" (Roberts. 2015). More specifically, the two experiments the researchers from Norway and Australia conducted were...
  • Table 1: Overview of the RT-program in study 1 (Robert. 2015)
    study 1 - 21 physically active men strength trained for 12 weeks (2 d/wk), with either 10 min of CWI or active recovery (ACT) after each training session. The sessions involved mainly the lower body. Training sessions were performed twice a week, separated by 72 h. The loads were set to 8-rep, 10-rep and 12-repetition maximum (RM), and weights corresponding to a proportion of each participant’s body mass.

    Strength training was progressive, and included 45° leg press, knee extension, knee flexion, walking lunges and plyometrics exercises. The plyometric component comprised countermovement drop jumps, slow eccentric squat jumps, split lunge jumps and countermovement box jumps. All strength training was supervised and was performed at normal room temperature (23–25°C). 
  • study 2 - 9 active men performed a bout of single-leg strength exercises on separate days, followed by CWI or ACT to elucidate the acute effects and potential mechanisms that explain the reduced gains in the chronic training study
The cold water immersion (CWI) itself was performed within 5 min after each training session. The procedure is described as follows: "Participants in the cold water immersion group sat in an inflatable bath (iCool iBody, iCool, Miami, Australia) for 10 min with both legs immersed in water up to the waist. Water was circulated continuously and maintained at 10.1 ± 0.3°C using a circulatory cooling unit (iCool LITE, iCool)" (Roberts. 2015). In contrast, the active recovery group performed 10 min active recovery at a self-selected low intensity on a stationary cycle ergometer (Wattbike, Nottingham, United Kingdom) at a really light mean intensity level of 59.5 ± 9.4 W.
Figure 2: Training-induced changes in type II fiber count and size (left, top), myonucle per fiber (left, bottom), leg press strength (A), knee extension strength (B), isometric torque (C) and RFD impulse (D | Roberts. 2015).
Just as it was the case in the much smaller wrist muscles in the Yamane study, the strength and muscle mass increases in the legs of the subjects in the Roberts study were blunted by the application of cold water (CWI). Practically speaking this means that the isokinetic work (19%), type II muscle fibre cross-sectional area (17%) and the number of myonuclei per fibre (26%) increased in the ACT group (all P<0.05) but not the CWI group.

If you want to know something about the reasons of these statistically significant and practically highly relevant difference are concerned, I suggest you take a closer look at the red box - it may also help you to fully understand the bottom line.
Bad News For Vitamin Fans - C + E Supplementation Blunts Increases in Total Lean Body and Leg Mass in Elderly Men After 12 Weeks of Std. Intense Strength Training | more
Bottom line: In conjunction, the studies presented in today's installment of "Too Much of a Good Thing" appear to confirm that regular post-exercise cold application to muscles might attenuate muscular and - even more surprisingly - the vascular adaptations to resistance training.

That this is neither muscle- nor subject-specific can be concluded based on the similarities of the results from the two studies cited above. Against that background, there is little doubt that Roberts et al. rightly conclude that "[i]ndividuals who use strength training to improve athletic performance, recover from injury or maintain their health should therefore reconsider whether to use cold water immersion as an adjuvant to their training" (Roberts. 2015) | Let me know what you think on Facebook!
References:
  • Roberts, et al. "Post-exercise cold water immersion attenuates acute anabolic signalling and long-term adaptations in muscle to strength training." The Journal of Physiology (2015): Accepted article.
  • Yamane, M., N. Ohnishi, and T. Matsumoto. "Does Regular Post-exercise Cold Application Attenuate Trained Muscle Adaptation?." International journal of sports medicine (2015).

Banana Starch, a Natural Resistant Starch That May Help Obese + Lean Alike Get & Stay Lean & Insulin Sensitive

$
0
0
Ripe or as in this case overripe bananas have little to no starch, green ones almost only starch and only little sucrose / fructose.
It is well-known that people with higher intakes of resistant starches have a reduced risk of becoming obese, developing diabetes and hyperlipidemia. Studies also indicate that starchy carb lovers have overall lower insulin concentrations and an increased insulin sensitivity compared to the average junk-food eater (McKeown. 2002; Liese. 2004), whose low dietary fiber consumption is linked to a reduced in insulin sensitivity and inflammation (Parillo. 2004).

What distinguishes whole grains and co from plain sugar, cornflakes and white bread is that they contain dietary fiber in its non-digestible form that is fermented in the colon, where the production short chain fatty acids (SCFA | learn more) triggers many of the well-established health benefits by direct and indirect effects on the gut-endocrine axis (Topping. 2001).
You can learn more about gut <> health interactions at the SuppVersity

Bugs Dictate What You Crave

Sweeteners & Your Gut

Foods, Not Ma- cros for the Gut

Lactulose For Gut & Health

Probiotics Don't Cut Body Fat

The Macrobiotic MaPi2.0 Diet
One of the best dietary sources of resistant starches are bananas... well, green bananas or rather the high resistant starch flour that's produced from green bananas. Although, it takes some processing to extract it from the bananas, it's classified as "RS2", i.e. naturally occuring resistant starch, because it is after all a native (vs. man-made) starch granule that is naturally highly resistant to digestion by α-amylase enzymes in the small intestine (Englyst. 1992).
Figure 1: Proximate compositions of the edible portion of bananas at different stages as classified by the color of banana peel (Lii. 1982) - only a small fraction of the original starch is already RS2, it takes processing to isolate the "natural" resistant starch from the bananas and the amount of RS2 in banana flour is variable 50%-84% (Lehmann. 2002).
Since it's a natural product, banana starches from different sources may have diverse structures and may thus also have a different degree of resistance to enzymatic hydrolysis. It is thus no wonder that previous studies by researchers from the Universidad Juá rez Autónoma de Tabasco has shown a large variety in terms of the amylose-content and resistance to digestibility among Banana starches from different sources. In general, though, all of them share the important property of being largely indigestible and being able to trigger a reduction in the glycemic and insulinic response compared to regular starches in both healthy and diabetic subjects (Ble-Castillo. 2010).
Figure 2: Effects of either 24 g of NBS dissolved in 240 mL of water per day or 24 g/day of soy milk dissolved in the same volume of water for 4 week (data represents within subj. comparisons | Ble-Castillo. 2010).
In fact, Ble-Castillo et al. were already able to show that within only 4 weeks on 24g/day of native banana starch (NBS) both the body weight and insulin sensitivity of obese type 2 diabetics significantly improved - and that not "on average", but on a "within-subject" basis as it can only be observed in cross-over study.
Why is it important to test not just in obese subjects? This is a good question and one that actually touches on (one of) the root cause(s) of the obesity pandemic. For decades, obese individuals have been told to eat like lean people. People of whom scientists observed that they stayed lean and healthy on low(er)-fat, high(er) carbohydrate diets. The consequences were - at least in some cases - literally "fatal." Over the past decade, though, we've seen lean, athletic people make the opposite mistake when they assumed that the same low-to-no-carbohydrate diet and supplements like lipoic acid that help the obese lean out would help them stay lean or become even leaner (learn more). The assumption that diets, supplements and - as in this case - certain dietary nutrients necessarily do the same thing in obese and lean individuals, however, is unwarranted and in many cases simply wrong.
In a more recent study, Guadalupe Jiménez-Domínguez repeated the Ble-Castillo study in a different, more diverse group of subjects:
Forty five subjects were screened for obese and lean participants. Anthropometric indexes and basic laboratory examinations were carried out. Participants for the obese group were included if they were healthy persons between 18 and 45 years of age, were obese, and had maintained stable weight during the three months prior to experimentation. Subjects in the normal-weight groups (lean group) were included if they were between 18 and 45 years of age, had 18.5–24.9 BMI values, had [normal fasting glycemia and]HbA1c values [...] and had maintained stable weight during the three months prior to experimentation. Subjects not included in this study were those with a previous diagnosis of diabetes, with fasting glycemia >126 mg/dL (> 7.0 mmol/L) or glycated hemoglobin > 6.5%, with digestive disorders, chronic diseases such as renal or hepatic, being pregnant, under psychiatric treatment, receiving medical or naturist treatment to reduce BW, practicing intense physical activity (> 90 min/week), receiving immuno-suppressants, or with a history of cigarette smoking or alcoholism. Thirty two participants were eligible for the study, 15 for the obese group and 17 for the lean group. However, only 10 subjects in each group completed the whole protocol" (Jiménez-Domínguez . 2015).
In said study, the subjects received a higher dose of 38.2 g of native banana starch (NBS) or the same amount of corn starch twice daily yet for only four days, before, on day 5, a 3-h meal tolerance test (MTT) was performed to evaluate the acute effects glucose and insulin responses that may explain the benefits Ble-Castillo et al. had observed (see Figure 2).
"All of the subjects received low-fiber diets at breakfast and lunch from the Nutrition Department’s restaurant during days 1‒4 of the treatment period. The low-fiber diet consisted of avoiding whole-grain/wholemeal breads and cereals, legumes, nuts, and seeds, and of removing the skins from fruit and vegetables" (Jiménez-Domínguez. 2015).
All subjects had to stick to the same baseline diet. Adherence to the diet and the randomly assigned supplements,
  • the NBS beverage, which contained 38.39 g of NBS, 31.82 g of soy milk, and 240 mL of purified water, and 
  • the DCS beverage, which contained 38.39 g of DCS, 31.82 g of soy milk, and 240 mL of purified water,
both of which had to be consumed in the fasting state (7:00 A.M.–9:00 A.M.) and before lunch (1:00 P.M.–3:00 P.M.), by counting the unopened sachets, a query regarding the missed servings and daily food records all subjects had to fill everyday before they went to bed.  
Figure 3: The 4 days on natural banana starch had quite significant beneficial effects on the glucose and insulin response to a standardized test-meal. It is yet also obvious that the obese saw greater benefits (Jiménez-Domínguez. 2015).
The most significant results in Figure 3 are not really surprising, though. As you may have expected, the native banana starch has a significant advantage over the corn starch, when it comes to its acute and chronic effects on glycemia in both, lean and obese individuals. An advantage that may well explain the significantly different metabolic effects in the Ble-Castillo study.
Figure 4: What is almost more important than the improvements in the 3h-glucose test that yielded beneficial results (see Figure 2) is that the continuous glucose monitoring over 48h depicted in this figure shows sign improvements in glycemia, as well Jiménez-Domínguez. 2015).
Bottom line: The fact that the acute provision of natural banana starch does improve the acute postprandial glucose and insulin responses in obese and lean individuals is yet only part of the good news. What's probably of greater physiological relevance is the fact that it also improved the insulin and glucose levels over the whole 48 h period that was assessed during the study.
Against that background it is not too disappointing that the resistant starch did not ameliorate the glucose responses to the test meal. A fact, that should still remind you that you have to watch what you eat - even if you make natural banana starch a regular constituent to your diet. The glucose excursions in response to high glycemic index foods / loads, of which scientists have long been speculating that they may propel the development type II diabetes, are after all at best ameliorated, yet not abolished by an increased intake of resistant starch.

Things may look very different, though if you completely replace "regular" starches with resistant starches. One of the easiest ways to do this may be by buying newly developed "functional" foods like spaghetti that contain 15% or more of their starch content in form of resistant starches from bananas and are still highly palatable (Hernández-Nava. 2009). Alternatively, you may want to check out the various recipes for resistant starches based cookies and other baked goods you can easily find on the Internet if if you google keyworkds like "banan bread", "banana cake", and "banana whatever"; and even though you won't find scientific evidence for the health benefits of each of the recipes, there is evidence for the health benefits of replacing regular starch in common recipes with resistant starches form a handful of proof of concept studies like Aparicio-Saguilan, et al. (2007)  | Comment or post your recipes on Facebook!
References:
  • Ble-Castillo, Jorge L., et al. "Effects of native banana starch supplementation on body weight and insulin sensitivity in obese type 2 diabetics." International journal of environmental research and public health 7.5 (2010): 1953-1962.
  • Englyst, Hans N., S. M. Kingman, and J. H. Cummings. "Classification and measurement of nutritionally important starch fractions." European journal of clinical nutrition 46 (1992): S33-50.
  • González-Soto, R. A., et al. "The influence of time and storage temperature on resistant starch formation from autoclaved debranched banana starch." Food research international 40.2 (2007): 304-310.
  • Hernández-Nava, R. G., et al. "Development and characterization of spaghetti with high resistant starch content supplemented with banana starch." Food Science and Technology International 15.1 (2009): 73-78.
  • Jiménez-Domínguez, Guadalupe, et al. "Effects of Acute Ingestion of Native Banana Starch on Glycemic Response Evaluated by Continuous Glucose Monitoring in Obese and Lean Subjects." International journal of environmental research and public health 12.7 (2015): 7491-7505.
  • Lehmann, Undine, Gisela Jacobasch, and Detlef Schmiedl. "Characterization of resistant starch type III from banana (Musa acuminata)." Journal of agricultural and food chemistry 50.18 (2002): 5236-5240.
  • Lii, Cheng‐Yi, Shuh‐Ming Chang, And Ya‐Lan Young. "Investigation Of The Physical And Chemical Properties Of Banana Starches." Journal Of Food Science 47.5 (1982): 1493-1497.
  • Liese, Angela D., et al. "Whole-grain intake and insulin sensitivity: the Insulin Resistance Atherosclerosis Study." The American journal of clinical nutrition 78.5 (2003): 965-971.
  • McKeown, Nicola M., et al. "Whole-grain intake is favorably associated with metabolic risk factors for type 2 diabetes and cardiovascular disease in the Framingham Offspring Study." The American journal of clinical nutrition 76.2 (2002): 390-398.
  • Parillo, M., and G. Riccardi. "Diet composition and the risk of type 2 diabetes: epidemiological and clinical evidence." British Journal of Nutrition 92.01 (2004): 7-19.
  • Topping, David L., and Peter M. Clifton. "Short-chain fatty acids and human colonic function: roles of resistant starch and nonstarch polysaccharides." Physiological reviews 81.3 (2001): 1031-1064.

Coffee - Different Roasts, Different Health Effects | Darker Roasts Better for Weight Loss, Lighter Roasts Healthier!?

$
0
0
Dark, medium or light roast - this is more than just a question of taste! The significant effect of roasting on the phenol-composition of coffee and the consequent health effects are rarely discussed.
You may remember my often misinterpreted article about bullet-proof coffee in which I actually defended the fad by providing evidence that the negative effects on blood lipids may actually be cause by not filtering the coffee vs. putting butter into it (read it). Well, today I would like to dig a bit deeper into the differential effects not of coffee brewing, but rather of coffee roasting on the of your favorite beverage's major active ingredients and its subsequent effects on your health.

Now, to get the bad news out of the way, the study from the West-German Centre of Diabetes and Health in Düsseldorf which evaluated these effects unfortunately did so in 118 overweight subjects.
You can learn more about coffee at the SuppVersity

Remember: With Coffee More Won't Help More

Coffee - The Good, Bad & Interesting

Three Cups of Coffee Keep Insulin At Bay

Caffeine's Effect on Testosterone, Estrogen & SHBG

The Coffee³ Ad- vantage: Fat loss, Appetite & Mood

Caffeine Resis- tance - Does It Even Exist?
The good news, however, is that the subjects who were recruited by articles in local media in the region of Düsseldorf, Germany, were mostly overweight, not obese (BMIs of ≥27 kg/m²) came from various age-groups (18–69 years old) and - this is important - were regular coffee consumers (at least 3 cups/day), just like you (?). With them being weight stable and free of any acute of chronic diseases (with the exception of type 2 diabetes mellitus), they are thus not the ideal study group, but decent subjects - even though we will have to be careful when it comes to making conclusions with regard to the health effects of differently roasted coffee for leaner and healthier people.

In the introduction I already alluded to the purpose of this study. What I still have to do, though, is to tell you exactly what the scientists wanted to know and how they tried to find the answer to their question(s). From previous studies, Kempf et al. knew that dark roast coffee, which is rich in the trigenolline byproduct N-methylpyridinium (NMP: 785 mmol/L) and low in chlorogenic acid metabolites has significantly more pronounced weight loss effects in pre-obese (but not normal-weight) subjects; see Figure 1) than light roast coffee when it is administered at doses of 500ml/day in a 2x4-week cross over study (Kotyczka. 2011).
Figure 1: Only the pre-obese subjects lost significant amounts of weight. A trend for higher greater weight loss in the dark roast phase of the cross-over study is however evident in all subjects (Kotcyzka. 2011).
Now, 4 weeks is not an acute study, but it's not exactly long enough to observe things like ceiling effects or the well-known "too much of a good thing" effect that may occur when agents with proven short-term benefits are administered over long(er) time periods.
A previously discussed problem with coffee is the formation of mold toxins, in particular ochratoxin A, when it's stored inappropiately. Luckily, roasting does - irrespective of whether you roast dark or light - sing. reduce the toxic mold (Van der Stegen. 2011).
What does the observational / epidemiological evidence say? Well, you know the problems with this type of data. Not only is it unreliable, it's also often not differentiated enough. It's thus impossible to tell whether the proven beneficial long-term effects of coffee consumption on type II diabetes risk (Greenberg. 2006; Muley. 2012; Natella. 2012 | you have to drink 3-5 cups per day) would occur with both the medium and dark roasts, but if we rely solely on the study at hand and the previously reported filtered- vs. unfiltered coffee (this is also scientifically confirmed based on observational studies | Muley. 2012) data, using medium roast coffee and a filter appears to be the most promising candidate for long-term health benefits from coffee consumption. This hypothesis is also warranted in view of the fact that the initial increase in total antioxidants that occurs with light roasting is reversed as the beans darken (del Castillo. 2002).
Against that background, you'd probably agree with Kerstin Kempf and her colleagues who thought it would be interesting to see "whether these effects on body weight would also be detectable after a longer-term consumption of dark roast coffee, in particular, in overweight adults" who are at the highest risk of dietary induced metabolic deteriorations (Kempf. 2015).
Figure 2: Flow sheet of recruitment and analysis (directly from Kempf. 2015)
In their randomized controlled trial, Kempf et al. compared the effect of 3-months consumption of (1) a medium roasted coffee blend rich in CQA and trigonelline versus a dark-roasted coffee blend rich in NMP (see Table 1 for the concentration of CQA, which is the sum of 3-, 4- and 5-caffeoylquinic acids, chlorogenic acid metabolites; NMP N-methylpyridinium, trigonelline and caffeine), as well as of (2) both groups combined for an estimate of general effects of coffee on body weight and selected cardiometabolic risk factors like HDL, LDL, triglycerides, adipokines (leptin, adiponectin), etc..
Table 1: Composition of medium roast (M)-coffee and dark roast (D)-coffee blends (Kempf. 2015).
What about filtered vs. unfiltered? The coffee in the Kempf study was handed to the subjects in regular commercially available coffee pads which look like coffee bagged in a filter. It is thus not surprising that similarly pronounced alterations in blood lipids as I've reported them before for unfiltered coffee, did not occur with either of the two roasts that were used in the study at hand.
During the study, the participants consumed an average of 4–5 cups per day of the roast they had been randomly assigned to. Even though that's probably more than the 500ml in the previously cited study by Kotcyzka et al. (see Figure 1) this was not enough coffee to exert significant effects on either the mean body weight, the body mass index or the waist circumference of the participants; and that's irrespective of whether the they consumed the dark (D) or medium (M) roast.
Figure 3: In contrast to the short-term cross-over study, the long(er) term study suggests that lighter roasts have the more beneficial effects on potentially CVD- (HDL + trigs) and T2DM (Trigs + Adiponectin) serum markers (Kempf. 2015).
Due to the different effects on some health-relevant metabolic markers, though, the study results are still SuppVersity news-worthy: In spite of the fact that the systolic blood pressure, which is obviously also a health relevant maker, decreased in the dark roast coffee group only (p < 0.05), other changes, in particular the contrast between
  • the significant increases in HDL and adiponectin, both of which have been linked to lower CVD and type II diabetes (T2DM) risk, which occurred in the medium roast group, and
  • the likewise significant increase in triglycerides, of which scientists believe that they pave the way for both diabetes and heart disease, which occurred only in the dark roast group,
would suggest health benefits of choosing lighter over darker roasts. How relevant those are for someone with perfect cholesterol and triglyceride levels may yet be questionable, also because neither of the two roasts affected the subjects' glucoregulation, or insulin levels (the scientists did observe an increase in the long-term glucose measure HbA1c (+0.1%), but this increase was identical in both groups and so marginal that it's hardly physiologically relevant).
If you look at the correlations between serum NMP levels (remember NMP is higher in dark roasts) the study confirms what the headline says: While darker roasts may favor weight loss (even though not necessarily sign. weight loss), it appears to have negative effects on leptin's healthy anti-diabetic and anti-CVD cousin adiponectin (Kempf. 2015).
So what? In contrast to the initially referenced study by Kotcyzka et al., the study at hand appears to confirm what previous studies on chlorogenic acid (CGA) already suggested (Thom. 2007; Onakpoya. 2015): Higher contents of CGA and/or its metabolites appear to be something to look for in both coffee extracts and regular coffee powder, because of their potential beneficial effects on blood glucose and CVD-markers.

The medium roast does after all not just contain more CGA metabolites, it does also have lower amounts of N-methylpyridinium, of which the study at hand clearly indicates that it is not just associated with weight loss (cf. Kotyczka, as well), but also w/ reduced adiponectin levels and overall less favorable effects on the few health-relevant changes the scientists observed during the study. It remains speculative, however, if said effects would have been different in (a) lean individuals (unlikely) or (b) subjects who don't belong to the ever-increasing group of regular coffee consumers (more likely), because the initial wash-out period during which the overweight subjects had to abstain from the consumption of coffee, cocoa, black or green tea probably didn't turn the coffee aficianados into caffeine naive coffee abstainers | Comment on Facebook!
References:
  • Crozier, Thomas WM, et al. "Espresso coffees, caffeine and chlorogenic acid intake: potential health implications." Food & function 3.1 (2012): 30-33.
  • del Castillo, María Dolores, Jennifer M. Ames, and Michael H. Gordon. "Effect of roasting on the antioxidant activity of coffee brews." Journal of Agricultural and Food Chemistry 50.13 (2002): 3698-3703.
  • Greenberg, James A., Carol N. Boozer, and Allan Geliebter. "Coffee, diabetes, and weight control." The American journal of clinical nutrition 84.4 (2006): 682-693.
  • Kempf, Kerstin, et al. "Cardiometabolic effects of two coffee blends differing in content for major constituents in overweight adults: a randomized controlled trial." European journal of nutrition (2014): 1-10.
  • Muley, Arti, Prasad Muley, and Monali Shah. "Coffee to reduce risk of type 2 diabetes?: a systematic review." Current diabetes reviews 8.3 (2012): 162-168.
  • Natella, Fausta, and Cristina Scaccini. "Role of coffee in modulation of diabetes risk." Nutrition reviews 70.4 (2012): 207-217.
  • Nicoli, M. C., et al. "Antioxidant properties of coffee brews in relation to the roasting degree." LWT-Food Science and Technology 30.3 (1997): 292-297.
  • Kotyczka, Christine, et al. "Dark roast coffee is more effective than light roast coffee in reducing body weight, and in restoring red blood cell vitamin E and glutathione concentrations in healthy volunteers." Molecular nutrition & food research 55.10 (2011): 1582-1586.
  • Onakpoya, I. J., et al. "The effect of chlorogenic acid on blood pressure: a systematic review and meta-analysis of randomized clinical trials." Journal of human hypertension 29.2 (2015): 77-81.
  • Thom, Erling. "The effect of chlorogenic acid enriched coffee on glucose absorption in healthy volunteers and its effect on body mass when used long-term in overweight and obese people." Journal of International Medical Research 35.6 (2007): 900-908.
  • Van der Stegen, Gerrit HD, Paulus JM Essens, and Joost Van der Lijn. "Effect of roasting conditions on reduction of ochratoxin A in coffee." Journal of Agricultural and Food Chemistry 49.10 (2001): 4713-4715.

Green Tea Supplement Boosts Resting & Exercise-Induced Fatty Acid Oxidation + Energy Expenditure - How Relevant is This for Losing Fat + Will it Impair Training Adaptations

$
0
0
"Yes", GTE will increase your total energy expenditure (TEE) and decrease the ratio of glucose to fat you're burning at rest and during your workouts, but "NO", it won't make your abs appear w/out dietin'.
You will remember that I am not exactly a fan of green tea extracts. In spite of the fact that there are studies that suggest reductions of both thyroid hormone and testosterone production, when you consume high(er) amounts, their anti-inflammatory effects appear to help (obese) people lose weight. In view of the fact that a recent study suggests that this does not interfere with the adaptational response to exercise, like vitamin C + E, for example (learn more), they are thus still among the most promising over-the-counter anti-obesity agents.

With that being said, the increase in fatty oxidation is often mentioned when people try to explain why green tea helps (obese) people lose fat.
You can learn more about tea at the SuppVersity

Use Roiboos for Stress & Virus Control

Water Temp. Influences Effects of Tea

Green Tea Can Reduce Your Testosterone

1L+ of Green Tea per Day Mess Up Your Thyroid

Aluminum, Lead & Arsenic & MORE in Your Tea

Will Drinking Tea Solve Your Sugar Problem?
As a SuppVersity reader, however, you know that a mere increase in the use of fats over carbohydrates will not translate into practical weight loss. Against that background it is important to investigate the effects of green tea extracts on both, the respiratory exchange ratio (RER), which is the quotient of glucose / fat that's used to fuel your basal and exercise-induced metabolic demands, as well as their effects on your total energy expenditure.

Luckily, a recent study from the Charles Darwin University and the University of New South Wales in Australia includes both measures of changes in RER, resting energy expenditure (REE) and the total energy expenditure (REE + activity induced energy expenditure).
Figure 1: Diagrammatic representation of the study design. * indicates blood collection. Lactate assessed at *1, *2, *4, *6, *9; catecholamines at *1, *4, *5, and glycerol at *1–*9 (Gahreman. 2015).
But that's not all. The scientists also took a look at the potential mediators of increased energy expenditure and fatty acid use like catecholamines and they did so in normal-weight young women (age: 21.5 +/- 0.5 years; body mass: 65.7 +/- 1.8 kg; BMI: 24.3 +/- 0.4 kg/m²; maximal oxygen consumption; VO2max): 32.1 +/- 1.7 mL/kg/min) and not the usual subjects: Overweight or obese post-menopausal women or male and female patients with type II diabetes.
Yes, it's official: Unlike vitamin C + E, GTE will not impair your gains! Ewa Jówko et al. (2015) were able to show that the consumption green tea extract (GTE) supplements in in dosages of only 245 mg polyphenols (including 200 mg catechins, among them 137 mg epigallocatechin-3-galate) does prevent the oxidative stress induced by repeated cycle sprint tests (RST) in sprinters without hindering the training adaptation in antioxidant enzyme system. What it does not do, either, is to decrease the exercise-induced muscle damage, or improve the sprint performance during the sprinters preparatory phase of their training cycle, though. Needless to say that studies involving different subject groups, dosages and training modalities would be required to eventually confirm that there are no anti-hormetic effects w/ GTE.
I have plotted the most relevant results of experiment the design of which is represented graphically in in Figure 1 for you in Figure 2. Please note that only the changes in VO2 which are indicative of an increased oxidation of fatty acids and the corresponding RER, the quotient of carbohdydrate oxidation and fat oxidation changed significantly.
Figure 2: Response at rest and during and after intermittent sprinting exercise in the green tea and placebo conditions; data expressed as relative differences between GTE and PLA (Gahreman. 2015).
It is thus all the more important to put the effects the consumption of three GTE (250 mg of camellia sinesis extract w/ 187.5 mg polyphenols, 125 mg EGCG) or placebo (cellulose) capsules the day before and one capsule 90 min before a 20-min intermittent sprinting exercise (ISE) cycling protocol consisting of
  • a 5-min warm-up at 30 W, and 20 min of ISE on a Monark Ergomedic 839E ergometer at 110 RPM during the sprint phase and 40 RPM during the recovery phase (pedal resistance for the sprint phase was calculated as 60% of each participant’s maximal power output) 
  • during which the subjects performed a total of sixty 8-s/12-s bouts totaling 8 min of sprinting and 12 min of easy pedaling recovery 
had on the metabolism of the fourteen untrained non-habitual coffee or green tea drinkers (< 2 cups per day) during the exercise, as well as before and after the ISE protocol:
Table 1: Mean power output, rating of perceived exertion, and lactate response to the sprinting and recovery components of the intermittent sprinting exercise for the placebo and green tea conditions (mean and SEM | Gahrmen. 2015).
  • There was a significant increase in fat oxidation post-exercise compared to at rest in the placebo condition (p < 0.01). 
  • After GTE ingestion, however, at rest and post-exercise, fat oxidation was significantly greater (p < 0.05) than that after placebo. 
  • Plasma glycerol levels at rest and 15 min during post-exercise were significantly higher (p < 0.05) after GTE consumption compared to placebo. 
  • There was no significant increase in total energy expenditure during or after exercise, though - that's in line with results Gregersen et al. (2009) generated in a study in normal-weight men, but different from some studies in normal-weight-to-moderately overweight men like Dullo et al. (1999) that report increases in TEE of ~2,8% over both, placebo and caffeine.
  • Compared to placebo, plasma catecholamines increased significantly after GTE consumption and 20 min after ISE (p < 0.05 | not shown in Figure 2). 
  • The effects are almost certainly not triggered by caffeine, because the capsules contained only 20mg of caffeine and previous studies have shown that only oral dose of more than 100 mg caffeine will elicit a significant increase in thermogenic response (Bracco. 1995; Dulloo. 1998 - suggest that 600-1,000mg/day is necessary for sign. increases in thermogenesis).
  • It's also worth noting that there were no significant differences in mean power output, RPE, lactate levels, RPM (Table 1), and HR levels between the GTE and placebo trials. This leaves little doubt that the effects were not mediated by direct ergogenic effects (= higher exercise performance / effort) in response to the GTE supplementation.
  • Lastly, it should be said that even though this was not tested in the study at hand, previous clinical trials like Bérubé-Parent et al. (2005) report identical thermogenic effects for low and high dosages of GTE. Thus, simply taking more GTE probably wouldn't have changed the results considerably.
Overall, the results of the study do thus support the ubiquitous claim that the ingestion of green tea extracts can significantly increase the fat oxidation at rest, during and after exercise when compared to placebo. In spite of the fact that the conclusion of the abstract to the study at hand makes it appear as if that was a practically highly relevant finding, there's one question neither the abstract nor the full-text of the paper actually address: Do the increase in fatty oxidation and the (albeit non-significant) increases in total and resting energy expenditure mean that consuming green tea extracts is going to help young, healthy, non-overweight women like the subjects in the study at hand lose body fat?
Figure 3: If you do the math and calculate the difference between the amount of energy the women would spend during a given week with 3x ISE sessions with and without GTE, the results are disappointing: The difference per week amounts to only 105.4kcal (1%), which is very unlikely to have a sign. effect on fat loss (calculated based on data from Gahreman. 2015).
Let's do some math to decide if the changes matter, or not... Ok, if they'd do the same ISE protocol three times a week and the increase in REE and TEE would not change over time, young, lean women who consumed GTE on a daily basis would burn an extra amount of only 105.4/kcal per week. That's a pathetic 1% increase of which I don't have to tell you that it is not only stat. not sign., but also practically irrelevant. In fact, this may well explain why you cannot expect green tea supplements to do the weight loss work for you. With the increases in fatty acid oxidation and energy expenditure being only two items on the list of purported anti-obesity benefits of GTE, the results of the study at hand do yet not necessarily mean that GTE supplements were totally useless. What they do mean, though, is that these supplements won't make young women lose body fat without the help of an energy restricted diet, which is still the indispensable backbone of any fat loss regimen.

In fact, specifically in the obese, the proven anti-inflammatory effects, as well as GTE's ability to reduce the absorption of both carbs and fats and to keep your appetite in check make it a viable addition to a reduced energy intake specifically in obese individuals (Hill. 2007; Rains. 2011). In view of the small increase in REE, but sign. impact on inflammation and glucose / lipid metabolism, specifically in the obese, it is thus  not surprising that meta-analyses report only a marginal association between green tea consumption and body weight on the population level, but significant beneficial effects on weight loss maintenance in overweight subjects after reductions in energy intake (Hursel. 2009) | Comment on Facebook!
References:
  • Bérubé-Parent, Sonia, et al. "Effects of encapsulated green tea and Guarana extracts containing a mixture of epigallocatechin-3-gallate and caffeine on 24 h energy expenditure and fat oxidation in men." British Journal of Nutrition 94.03 (2005): 432-436.
  • Bracco, David, et al. "Effects of caffeine on energy metabolism, heart rate, and methylxanthine metabolism in lean and obese women." American Journal of Physiology-Endocrinology and Metabolism 269.4 (1995): E671-E678.
  • Dulloo, A. G., et al. "Normal caffeine consumption: influence on thermogenesis and daily energy expenditure in lean and postobese human volunteers." The American journal of clinical nutrition 49.1 (1989): 44-50.
  • Dulloo, Abdul G., et al. "Efficacy of a green tea extract rich in catechin polyphenols and caffeine in increasing 24-h energy expenditure and fat oxidation in humans." The American journal of clinical nutrition 70.6 (1999): 1040-1045.
  • Gahreman, Daniel, et al. "Green Tea, Intermittent Sprinting Exercise, and Fat Oxidation." Nutrients 7.7 (2015): 5646-5663.
  • Gregersen, Nikolaj T., et al. "Effect of moderate intakes of different tea catechins and caffeine on acute measures of energy metabolism under sedentary conditions." British journal of nutrition 102.08 (2009): 1187-1194.
  • Hill, Alison M., et al. "Can EGCG reduce abdominal fat in obese subjects?." Journal of the American College of Nutrition 26.4 (2007): 396S-402S.
  • Jówko, Ewa, et al. "The effect of green tea extract supplementation on exercise-induced oxidative stress parameters in male sprinters." European journal of nutrition (2014): 1-9.
  • Phung, Olivia J., et al. "Effect of green tea catechins with or without caffeine on anthropometric measures: a systematic review and meta-analysis." The American journal of clinical nutrition 91.1 (2010): 73-81.
  • Rains, Tia M., Sanjiv Agarwal, and Kevin C. Maki. "Antiobesity effects of green tea catechins: a mechanistic review." The Journal of nutritional biochemistry 22.1 (2011): 1-7.

Creatine & Caffeine Don't Mix!? True or False? Recent Study Sheds *New* Light on an Important Supplement Question

$
0
0
Will a small cup of coffee ruin the benefits you can derive from creatine supplementation? Sounds impossible, but it's a die-hard rumor with surprising scientific backing. Now, a new study could finally settle the debate.
As topic for the thesis he submitted to the faculty of the University of North Carolina at Chapel Hill in partial fulfillment of the requirements for the degree of Master of Arts at the Department of Exercise and Sport Science (Exercise Physiology), Eric T. Trexler selected the "Effects of Creatine, Coffee, and Caffeine Anhydrous on Strength and Sprint Performance" (Trexler. 2015).

This is, as some of you will immediately recognize, at least in parts, a variation of the age-old question, whether the purported diuretic effects of caffeine would impair the proven ergogenic effects of creatine. In that, it's a variation, because the domain of concern is not - as it is for most bros - solely restricted to resistance training, but extends beyond the investigated one-rep max on the leg press and into the realms of sprint performance. But let's tackle things one after the other.
You can learn more about creatine at the SuppVersity

Creatine Doubles 'Ur GainZ!

Creatine, DHT & Broscience

Creatine Better After Workout

ALA + Creatine = Max Uptake?

How is Creatine Metabolized?

Build 'Ur Own Buffered Creatine
As Trexel points out, the study at hand "sought to directly compare effects of caffeine-matched (300 mg) doses of caffeine anhydrous [CAF | that's basically the same stuff you will have in your pre-workout] and coffee [COF | that's ~3 cups of the beverage that many of you will be drinking on a daily basis] on strength and sprint performance, and to determine if CAF or COF intake modulate the effects of creatine (CRE) loading" (Trexel. 2015 | my emphasis).

Now, you propably don't need a PhD to be able to tell that creatine and caffeine are currently among the most popular and best proven nutritional ergogenic aids. What is odd, though, is that supplement companies have made a habit of packing both into one product, even though there's the long-standing suspicion that caffeine may blunt the effects of creatine.
Figure 1: Caffeine blunts the beneficial effects of creatine loading on dynamic torque production (Vandenberghe. 1996).
And there are in fact a handful of people who still believe this was a huge mistake - mostly, because early studies into the concomitant administration of both agents like a Vandenberghe et al. (1996) clearly indicate that "caffeine counteracts the ergogenic action of muscle creatine loading" by (in this particular study) blunting the increase in dynamic torque production. This study, as well as a study by Hespel et al. who observed opposing effects of creatine and caffeine on the relaxation time of skeletal muscle (creatine decreases it, while caffeine increases it), are reason enough for skeptics like Tarnpolsky et al. (2010) to say that "there is no rationale for their simultaneous use" even though they have to admit that evidence is inconclusive:
"Although there is little rationale for taking both caffeine and creatine simultaneously as ergogenic aids, some have reported that the acute consumption of both negated the ergogenic benefits." (Tarnpolksy. 2010).
On the other hand, there are good reasons to be skeptical about the implications of the Vandenberghe and Hespel studies, too. It must be taken into consideration, for example that...
  • When is the best time to take your creatine supplement? Before or after your workouts? Learn more in this Suppversity Classic: "Lean Mass Advantage of Post- vs. Pre-Workout Creatine Supplementation Confirmed. Older Trainees Benefit Most" | more.
    the short term creatine loading protocol used in Vandenberghe's study is no longer recommended and the assumption that caffeine + creatine won't mix in the long-run would require studies that investigate that in the long run,
  • the study cross-over design of Vandenberghe's study in which the subjects received all three treatments in random order incorporated a 3-week washout period that was as follow up studies on the long-lasting effects of creatine supplementation suggest probably insufficient for the creatine levels to return to normal; after all, the minimal washout period for creatine is estimated to be ~4 weeks (Hultman. 1996)
  • the Vandenberghe study used only one exercise to test the effects and does therefore hardly reflect the effects on real-world athletic performance, 
  • lastly, many researchers have dismissed a potential interaction between creatine and chronic caffeine ingestion, because some of the early creatine studies with highly beneficial results have administered it dissolved in coffee/tea (Greenhaff. 1993; Birch. 1994); so have more recent studies that in which the effects of one of the previously mentioned nutraceuticals were tested (Smith. 2010; Lowery. 2013)
Against that background and in view of the fact that none of the long(er) term creatine supplementation studies that dominate the scientific landscape of the late 20th and early 21st century reports that coffee connaisseurs wouldn't let alone couldn't benefit from creatine supplements (Fukuda. 2010; Smith. 2010), the results of Vandenberghe's study would have to be reproduced even if there was no contradictory evidence from a 1998 study by Vanakosk et al. who observed no interaction between creatine and caffeine in their crossover study (Vanakosk 1998).
Where's the acute phase study data? While Trexel did an acute phase and a chronic supplementation study, I will not discuss the results of the acute phase study in detail, because the only effects Trexel observed in this part of the his experiment were (unsurprisingly)  the well-known beneficial effects of caffeine on acute exercise performance and even those were ... well, let's just say 'surprisingly inconclusive' - which means that I have seen much more significant benefits from caffeine in different experimental contexts (see Astorino. 2010 for a review).
To eventually find out if thousands of athletes competing in both aerobic and anaerobic sports are making a mistake, when they're pounding commercially prepared or self-made creatine + caffeine concussions, the initially mentioned study by Trexel was designed to find out if chronic coffee or caffeine anhydrous consumption blunts the ergogenic effect of creatine loading on strength and sprint performance outcomes.

Using subjects with previous resistance training experience, Trexel determined if caffeine (CAF) or coffeee (COF - both at 300mg caffeine per serving) intake modulates the effects of creatine (CRE) loading with 20 g/day, split between 4 servings by conducting the same battery of strength and sprint performance tests before and after the acute and chronic supplementation with coffee, creatine or caffeine or a combination of both (CRE + CAF or CRE + COF).

Unfortunately, the results of the by all means well-designed study are not clear enough to settle the debate once and for all even though, no inhibitory effects of caffeine or coffee on the ergogenic effects of creatine were observed. Personally, I'd say, though, that the total evidence would suggest that if there is an inteference, it's probably negligible in the long run.

But let's get back to the study at hand and what it tells or rather doesn't tell us about a possible interference: As you can see in Figure 2, Trexel's study does not suffer from the same problems as the previously cited study by Vandenberghe. It's not a cross-over study, so too little washout time is not a problem. On the other hand, the number of subjects (13-14 in each group) is not exactly high enough to make sure that the differences you're expecting will be significant if you happen to have selected a few creatine non- or hyper-responders that mess with your data.
Figure 2: Overview of the study design for the chronic supplementation study (Trexel. 2015)
An additional problem is the total length of the study. With only 5 days, we are - once again - not in the practically more relevant longer-term chronic supplementation time-frame that would mimic the way most of you are probably using their creatine products. Yes, previous studies have shown significant effects even in a time-frame as short as that, but you will also know that creatine is not only one of the few supplements where the effects may accumulate over weeks, but also one of the few where long-lasting effects of previous (even way beyond the previously cited wash-out period) can be safely excluded. Against that background one could (I know you're always smarter after you've done a study, so no smart-assing here) argue that it may not have been enough to pick subjects that had not taken creatine in the last three moths, but were not necessarily creatine naive.
What distinguishes creatine responders from non-responders? This question has still not been satisfactorily answered, but evidence from a 2004 study by Syotuik et al. indicates that different baseline creatine levels, the total muscle mass and the ratio of fast- to slow-twitch may determine whether you're going to see huge gains or no effect at all. To be more precise, Syotuik et al.'s observation suggest that ideally, you'd have a low baseline creatine level, lots of lean muscle and a high number of fast-twitch muscle fibers.
Yes, I know, being "creatine naive" does not sound like it could be important, but but in view of the anecdotal evidence that no "creatine cycle is as effective as the first one" as well as the scientific evidence that one's baseline creatine levels have a significant effect on whether you "respond" or "don't respond" to supplementation (Syrotuik. 2004 | see red box, as well), it could at least partly explain why the results of the study are somewhat inconclusive.
Figure 3: If we go by serum creatine levels it would seem as if caffeine wasn't a problem - specifically if it comes from coffee. Unfortunately, serum creatine is pretty irrelevant and the performance data in form of changes in total work and the number of reptitions on the leg press and bench showed no signifant intergroup difference. Now this would suggest that it's not problem to take creatine with coffee or caffeine, but convincing evidence that caffeine does not impair the beneficial effects of creatine would require these beneficial effects to show (data after chronic suppl. from Teaxel. 2015).
And with "inconclusive" I am attributing the data in Figure 3 which tells you - more than anything else - that neither creatine norcaffeine produced a significant performance increase in any of the relevant parameters over the five-day study period.

Only the increase in plasma creatine was statistically significant. That's nice, because it shows that mixing your creatine into instant coffee, which is what the guys in the coffee + creatine group were told to do, appears to rather boost than hamper the intestinal absorption of creatine. Eventually, however, this information is irrelevant, because it is the increase in intramuscular phosphocreatine stores that's driving the (not observed) performance benefits - not an increases in serum creatine.
Another die-hard creatine myth based - just like the myth from the study at hand - on the results of a single study (and this time without rational hyopthesis to explain the results) is that creatine would increase DHT and thus trigger hair loss and prostate cancer | Learn more about this bogus.
So are we left with nothing? Not exactly, after all, the study confirmed that caffeine and coffee both have their merit as acute phase ergogenics. It's correct, though, that this does not tell us, if caffeine will blunt the beneficial effects of creatine in either the short or the long run. In this respect, we are thus about as wise as before; and that in spite of the fact that Trexel is obviously right when he writes that "[t]he addition of CAF and COF did not appear to influence performance outcomes of CRE supplementation" (Trexel. 2015). In view of the fact that no significant effects of creatine supplementation were observed, we still need future long(er) term studies that combine coffee / caffeine + creatine and tests it against placebo and creatine alone - maybe even in different dosages - to answer the question whether it does or doesn't matter if you consume caffeine when you're "on" creatine once and for all | Comment on FB!
References:
  • Astorino, Todd A., and Daniel W. Roberson. "Efficacy of acute caffeine ingestion for short-term high-intensity exercise performance: a systematic review." The Journal of Strength & Conditioning Research 24.1 (2010): 257-265.
  • Birch, R., D. Noble, and P. L. Greenhaff. "The influence of dietary creatine supplementation on performance during repeated bouts of maximal isokinetic cycling in man." European journal of applied physiology and occupational physiology 69.3 (1994): 268-270.
  • Fukuda, David H., et al. "The possible combinatory effects of acute consumption of caffeine, creatine, and amino acids on the improvement of anaerobic running performance in humans." Nutrition research 30.9 (2010): 607-614.
  • Greenhaff, Paul L., et al. "Influence of oral creatine supplementation of muscle torque during repeated bouts of maximal voluntary exercise in man." Clinical Science 84 (1993): 565-565.
  • Hespel, Peter, B. Op‘t Eijnde, and Marc Van Leemputte. "Opposite actions of caffeine and creatine on muscle relaxation time in humans." Journal of Applied Physiology 92.2 (2002): 513-518.
  • Hultman, E., et al. "Muscle creatine loading in men." Journal of applied physiology 81.1 (1996): 232-237.
  • Lowery, Ryan P., et al. "Effects of 8 weeks of Xpand® 2X pre workout supplementation on skeletal muscle hypertrophy, lean body mass, and strength in resistance trained males." J Int Soc Sports Nutr 10.1 (2013): 44.
  • Smith, Abbie E., et al. "The effects of a pre-workout supplement containing caffeine, creatine, and amino acids during three weeks of high-intensity exercise on aerobic and anaerobic performance." J Int Soc Sports Nutr 7.10 (2010): 10-1186.
  • Syrotuik, Daniel G., And Gordon J. Bell. "Acute Creatine Monohydrate Supplementation: Adescriptive Physiological Profile Of Responders Vs. Nonresponders." The Journal Of Strength & Conditioning Research 18.3 (2004): 610-617.
  • Tarnopolsky, Mark A. "Caffeine and creatine use in sport." Annals of Nutrition and Metabolism 57.Suppl. 2 (2010): 1-8.
  • Trexler, Eric T. Effects of creatine, coffee, and caffeine anhydrous on strength and sprint performance. Diss. THE UNIVERSITY OF NORTH CAROLINA AT CHAPEL HILL, 2015.
  • Vanakoski, Jyrki, et al. "Creatine and caffeine in anaerobic and aerobic exercise: effects on physical performance and pharmacokinetic considerations." International journal of clinical pharmacology and therapeutics 36.5 (1998): 258-262.
  • Vandenberghe, K., et al. "Caffeine counteracts the ergogenic action of muscle creatine loading." Journal of applied physiology 80.2 (1996): 452-457.

Overreaching A Promising, But Tricky Training Strategy - Here's How it Rewards Pains & Effort With 5% Higher Peak Power Gains After 12 Workout vs. Training W/ Adequ. Rest

$
0
0
No rest(-day) allowed - at least during the short (!) overreaching phase you will be training through the pain & fatigue if you are determined to succeed.
You've read about the difference between the catabolic, anti-adaptive effects of overtraining and overreaching before, but do you actually know what it takes to overreach not train? In a recent study from the Ritsumeikan University you may find some clues that may help us answer these questions, but before we do so, let's take a brief look at the study design and outcomes, the authors give away in the title already: "Planned Overreaching and Subsequent Short-term Detraining Enhance Cycle Sprint Performance" (Hasegawa. 2015) - A study designed to investigate the effects of a training program consisting of planned overreaching and subsequent short-term detraining on sprint performance.
You can learn more about overtraining and checking your training status at the SuppVersity

Heart Rate Variablity (HRV)

ABEL Sports Test + More

Overtraining & Undereating

Calculate your Energy Intake!

Overtraining W/ Only 25min/day?

Reinvent Your Training!
Over the course of the three-week (*) study, 24 physically active men (age, height, and body weight (BW) were 21.7 ±1.4 years, 175.2±4.3cm, and 75.0± 14.6kg, respectively) participated in an 18-day sprint-training program. None of the subjects was participating in a regular training program (*) at the start of the study, when they were randomly allocated to one out of two training groups:
  • the overreaching-detraining (OR-DT), in which the subjects performed maximal cycle sprint training on 12 consecutive days, followed by 6 days of detraining (=no exhausting physical activity at all | like 12xA - 6xR) and 
  • the control (CON) group, in which a complete day of rest was provided after every 2 successive training days (like A-A-R-A-A-R- [...])
For both groups, the training sessions consisted of 2–4 sets of 30 s of maximal pedaling on an electromagnetic cycle ergometer (Powermax V3, Konami Sports & Life Co., Ltd., Tokyo, Japan). Each set was followed by a 7-min rest period. The resistance for the first set was set 7.5% of BW, and it was reduced to 5.0 % of BW for the subsequent sets. During each training session, the subjects were verbally encouraged and instructed to give their maximal effort.
Figure 1: Overview of the study design - Training schedules and number of sets (Hasegawa. 2015).
You can see a summary of the protocol in Figure 1 and may (maybe rightly) complain that the OR-DT group got more rest before the post-test on day 18 than the CON group.
What do we already know about overreaching? Unfortunately, we don't know how to make sure it's not turning from overreaching to overtraining, but that's one of the many questions scientists will still have to answer (Mackinnon. 2000). What we do know, though, is supplements like creatine or 0.4g/kg body weight EAAs and likely whey can help conserve the performance during and thus improve the outcome after overreaching periods (Ratamess, 2003; Volek. 2004). We also know that overreaching attenuates the testosterone response to workouts in untrained, but not trained individuals and A.M. cortisol, but no the cortisol response to workouts in both trained and untrained subjects (Fry. 1994). Both, the amount of creatine kinase and glutamate in the blood which can be used as indicators of muscle damage increase during periods of overreaching (Halson. 2003). Lastly, the changes in the immune markers indicate that athletes may be particularly prone to infections during phases of extra-(=too)intense training (Gleeson. 2002).
That's truly unfair, but it's the reality of competitive sports (*). After all, you have the choice of training like the control group before the event to make sure that you're full of sap or, alternatively, to follow the OR-DT program and start on game day maximally refreshed and with an adaptational bonus in the peak-power domain that may make all the difference when you're sprinting towards and over the finish line (see Figure 2). 
Figure 2: Relative peak power and mean power during the pre- and post-test days as well as on the differently timed training days in the OR-DT and CON group (Hasegawa. 2015).
Now, I guess the less-regular SuppVersity readers will be surprised to hear that all that happened in spite of the lack of significant differences in the testosterone levels, markers of muscle damage, lactate and glucose in the blood of the subjects in the two arms of the study. 
The supercompensation of phospho-creatine stores may also explain the power gains in the overreaching + detraining group (Haegawa. 2015), but still, do not underrate the ergogenic benefits of the stress hormone cortisol - it's on the WADA list for very good reasons, esp. wrt endurance sports!
What's powering these peak performance gains? Ok, one thing is discussed below in detail: The 6-days of rest allowed for sign. higher cortisol outputs during the test and that's actutely a good thing. There's yet more: The intra-muscular phosphocreatine concentrations, the same stuff you wanna boost, when you consume creatine, which were not different before the study, developed very differently over the course of the study. While the intramuscular PCr concentrations increased significantly after 12 days of daily training in the OR-DT group (P<0.05, 69 % increase relative to value before training, described as "Post 1" in the Figure on the left, the CON group subjects saw no change in PCr, at all. With it's ability to fire short term high performance bouts, the PCr advantage may also be at the heard of the relative preak power benefits of OR-DT group.
For regular SuppVersity readers this should be as unsurprising, though as the fact that the OR-DT's ability to maximize their cortisol response at the post test is probably (one of the) reasons that they kicked their competitions a$$ when it comes to peak performance... unbelievable? 
Figure 3: Cortisol levels in the Hasegawa study (2015) in the pre- and post-test (left); maximal endurance (T in min) in Katia Collomp's 2008 investigation into the effects of acute glucocorticoid administration on cycling endurance (right).
Well, take a look at the endurance performance of the cyclists in Katia Collomp's 2008 study (Figure 3, right) - what did almost double the endurance of her subjects? Yes, it was synthetic cortisol - prednisolone at a dosage of 60mg to be precise. And just as it is important to point out that these benefits are restricted to acute short term increases, it is noteworthy, that, in the Hasegawa study, the cortisol response during the over-reaching phase was as, if not more blunted as it was in the CON group.
SV Classic: "Optimal Rest Between Workouts? Despite Inter-Personal and Exercise-Specific Differences 72h May be a Valid Rule of Thumb - Especially for Compound Movements" | more
(*) What do these asterisks mean and what's the bottom line? Two good questions which are, as I would like to point out closely related. How? Well, let's take the training duration of only 18 days, for starters. The easiest way to turn overreaching into overtraining and thus all beneficial short-term into long-term negative effects is by overreaching for too long. And two weeks are in fact  quite a good time-frame to train like a maniac and complete rest for ~50% of the time thereafter doesn't look like a bad way to program it either. If you go longer, the increased activity of glycolytic and other catabolic enzymes, as it was observed by Parra et al. (2000) after 14 day of everyday, no rest incremental sprint training protocols, may ruin your results and fitness.

Unfortunately, there's also asterisk (*) number two you will find right after the information that we are not dealing with professional athletes. That's a problem, because it is unlikely that the ordeals a seasoned athlete can sustain and still gain are the same as those of a rookie. This does not mean that everyone needs more or longer hammering, though. In fact, many athletes are chronically overtrained. For them (Matos. 2011), the 6-day rest may be a good idea; to try to increase their performance by strategic overreaching,on the other hand, would be madness and obviously counter-productive.

Overtraining is real and it's blocking future and reversing past gains | more
This leads us to asterisk (*) number three and two conclusions: (A) There is no question that the protocol used in the study would have beneficial for the participants had there been a cycling competition on the post-training day. (B) The implications for professional athletes depend on their previous training style. For those on a sane protocol, similar benefits can be expected, although intensity and duration of the overreaching phase may have to be upgraded (I am thinking of doing two-a-days, for example). For the underestimatedly large fraction of (wanna-be) athletes who are chronically overtraining, anyways, any form of strategic overreaching would be counterproductive | Comment on FB!
References:
  • Collomp, Katia, et al. "Short-term glucocorticoid intake combined with intense training on performance and hormonal responses." British journal of sports medicine 42.12 (2008): 983-988.
  • Fry, Andrew C., et al. "Endocrine responses to overreaching before and after 1 year of weightlifting." Canadian Journal of Applied Physiology 19.4 (1994): 400-410.
  • Gleeson, Michael. "Biochemical and immunological markers of over-training." Journal of sports science & medicine 1.2 (2002): 31.
  • Halson, SHONA L., et al. "Immunological responses to overreaching in cyclists." Medicine and science in sports and exercise 35.5 (2003): 854-861.
  • Hasegawa, Y., et al. "Planned Overreaching and Subsequent Short-term Detraining Enhance Cycle Sprint Performance." International journal of sports medicine (2015).
  • Mackinnon, L. T., and S. L. Hooper. "Overtraining and overreaching: Causes, effects and prevention." (2000): 487-498.
  • Matos, Nuno F., Richard J. Winsley, and Craig A. Williams. "Prevalence of nonfunctional overreaching/overtraining in young English athletes." Med Sci Sports Exerc 43.7 (2011): 1287-94.
  • Parra, J., et al. "The distribution of rest periods affects performance and adaptations of energy metabolism induced by high‐intensity training in human muscle." Acta Physiologica Scandinavica 169.2 (2000): 157-165.
  • Ratamess, Nicholas A., et al. "The effects of amino acid supplementation on muscular performance during resistance training overreaching." The Journal of Strength & Conditioning Research 17.2 (2003): 250-258.
  • Volek, Jeff S., et al. "The effects of creatine supplementation on muscular performance and body composition responses to short-term resistance training overreaching." European journal of applied physiology 91.5-6 (2004): 628-637.

Get Your Macros Straight in Two Minutes - Just Three Steps for Low- and High-Carbohydrate Diets | Includes Examples

$
0
0
If you want to "hit your macros", you better hurry to find out what those macros are, before you start weighing everything. So, here are the three steps you got to take before you start ;-)
In view of the fact that I am getting questions like "how do I set up my macros" again and again... and did I say "again"? I would like to briefly outline a very easy you can use to create a baseline macronutrient template you can use for yourself or clients. The process itself involves some mathematics, but don't worry, it's easy and with the examples, I am going to give, even the math-haters out there will be able to come up with a new macro-template in ~2 minutes time. Before I go ahead I would yet briefly like to point out that I am a huge proponent of "food quality" and not a fan of "if it fits your macros" aka "I just want to eat all the shit I have always been eating!" So, for your own sake, please don't forget to check, where those "macros" are coming from.
Don't forget that health and looking good naked require eating right and working out!

Exercise Research Uptake Nov '14 1/2

Exercise Research Uptake Nov '14 2/2

Weight Loss Supplements Exposed

Exercise Supplementation Quickie

Squat 4 Min B4 Workout, Chains & Bands + More

Read the Latest Ex. Science Update
Ok, let's get back to the two minutes: I have to admit, if you want to do it right and have no clue how much energy you want to consume on a daily basis, the whole process may take a bit longer than two minutes, but for the rest of you, it's going to be two minutes, I promise.
  • Step 1: Find your / a client's daily energy requirements: This may be the fastest or longest-taking step. If you already know how much energy you want to consume or have a client consume on a daily basis, skip this step and go right to step 2.

    You're still there? Well, ok. This means you don't know how much energy you want to consume or prescribe and want me to tell you how to calculate that? Well, I will do that, but I personally don't recommend to calculate your requirements, and I am pretty sure that after you see my example calculation you will be similarly convinced that only Mr and Mrs Average will get good results with the most used equation to calculate your resting metabolic rate (RER) and total energy requirements (TEE) - the Harris-Benedict equation:
    Equation 1: The Harris-Benedict Equation in all its usless glory - don't rely on this or any other formula when you're trying to estimate your or a client's dietary requirements.
    That's it, the Harris-Benedict equation in all its useless glory. Well, then... let's take an example, not a totally extreme one, though, let's say you have two clients, a man and a woman:
    • Obese Man - obese at 175kg body mass, he is 27 years old, but looks like an overweight teenager, with his body size of only 179 cm he's having an extra-hard time moving his frame to the fridge and back, which is - as he freely admits - the only "exercise" he has gotten ever since he's lost his job 5 years ago
    • Active Woman - active, middle-aged, weighs 58 kg, you checked, because you know middle-aged women lie about their weight, her passport says age 47, her body size is 160 cm, and she says that she jogs regularly ("Roughly three times a week, I'd say"), no HIT, HIIT or strength training
    Now, in theory you can calculate our exemplary clients' resting metabolic rate (RER) using Equation 1. In other words, the equation is going to tell you the amount of energy our imaginary client would need if he or she was minimally physically active (that's  not 100% bed-rest, but close to). To go from the RER to the total energy their total energy requirements (TER) or total energy expenditure (TEE), you still have to multiply the value by ... for ...
    • 1.2 - non-active couch potato and office worker,
    • 1.3 - people who use the bike or walk or do other light physical exercise 1-2x/wk
    • 1.4 - people who jog or do similarly medium intense physically activity 3-5x/wk
    • 1.6 - the average recreational active gymrat who trains intensely at least 3x/wk
    • 1.7 - someone who lives in the gym and takes the stairs ;-) 
    For our two example clients, the obese man at 175 kg body mass (age 27, body size 179 cm) who moves to the fridge and back and our actually pretty active middle-aged women at 58 kg, who jogs regularly but hates high intensity workouts, the calculations and results are look like this:
    Equation 2: Calculation of the total daily energy requirement for the two example clients.
    I assume that you'd agree that that both values are way off what would make sense for the two, right? And that despite the fact I didn't chose the people on the really extreme ends of the "ripped female athlete to sign. obese male couch potato"-scale - for people on the edges, the results may well be even worse.

    So, I hope you see that you are way better off if you are having your clients log their food intakes for a week (at least three days) and determine their intake (or yours if you're doing this for yourself) by dividing the total energy intake by 7.
Every client should to a long(er)-term food log: If you don't have data on how much and what exactly a client eats, you cannot work with him. It's also important to get an idea of what he likes and doesn't like. After all, the best diet is useless if a client does not adhere to it - and we all know that a candy lover on a eggs and bacon diet is going to have a harder time than a bacon lover on a ketogenic diet. Also, for clients, this obviously means that any trainer who gives you a detailed meal-plan without having seen at least a three-day food log, is someone you should not rely on.
  • Using the food log will not only allow you to avoid bogus predictions for people who are not "average", but it will also allow you to 
    • estimate the previously mentioned food quality of your / your clients diet, 
    • decide based on what you or he / she like whether a high carb or low carb approach is the one with a higher chance of 100% adherence and
    • see that the current energy intake is at a level that would hardly sustain a toddler, due to years of dieting and meanwhile useless reductions in energy intake (if that's the case, click here)
  • Now that you hopefully know how much energy you or your client need on daily basis, there's one last thing you have to do before you proceed to step #2: Determine if you, he or shee needs just the TER or 15-35% less (in very overweight clients even 40%-50% less) or 10-15% more in order to lose body fat or gain muscle, respectively.
  • Step 2: Decide whether you want to go high or low carbohydrate: Now that you know "exactly" how much energy you or your client are going to consume on a daily basis, it's about time to decide which dietary prescription, i.e. high or low carbohydrate, you or your client are going to follow.

    Unless you're going to go keto which would require you to set a limit of ~10-15g of protein per meal to stay in full ketosis, you still have 30s to think about whether it should be high or low carb, while you're determining the protein baselines which are:
    • 1.2-2.2 g/kg (2.0g = suggested, unless lightweight) total weight for men
    • 1.2-1.8 g/kg (1.5g = suggested, unless lightweigh) total weight for women
    The lower recommendation for women is due to the fact women have a lower total body weight and less muscle on their frame. If you feed a tiny woman 2.0g protein per kg body weight, you may end up having her eat so much protein that there's no room for other nutrients, which is bad news in general, and very bad news for women who are much more susceptible to a lack of readily metabolizable energy that has not to go to the energy and time-consuming process of gluconeogenesis in the liver (and yes, you'd waste the protein anyways, because it would be turned into glucose).

    I think your 30s time for consideration are over and hope you've used the time wisely to decide if you want to go low or high carb? In general, the rule of thumb is: "The fatter you are, the greater the low-carb advantage is going to be." Now, as a SuppVersity reader you've read enough about low and high carbohydrate diets, their advantages and pitfalls on the SuppVersity to be able to decide, so (wo-)man up and take the responsibility and use
    • 40-100g (80g suggested for men; 50g = suggested for women) as a minimum daily fat intake for yourself or clients on high carbohydrate diets or
    • 50-120g (90g = suggested for men; 60g = suggested for women) as a minimum daily carbohydrate intake for yourself or clients on low carbohydrate diets and 
    • <20g of carbohydrates (best divided across meals) on a truly ketogenic diet 
    As you should have noticed you will always pick the macronutrient you're "avoiding" on your diet and determine a baseline for this. The reason is that the amount of carbs and fats that are appreciable baseline on high fat and high carbohydrate diets do not scale linearly with your or a clients weight. The idea is that you want to consume as little as it takes for optimal health and function. Accordingly, you never want to go to zero fat for endocrine reasons and you never want to cut the baseline carb intake so low that you force the body to convert a lion's share of protein into glucose. The latter is by the way something that happens if you follow a "almost only protein" diet and trust me, in the long term that's not good for either your health, or your looks and performance.
  • Step 3: Calculate the amount of your primary energy source: The last step is actually the easiest one. You take the values from the previous steps, i.e. your total daily energy requirement (+/ - X% if dieting or bulking) and subtract the energy equivalents from Step #2 by filling your data into either the high or the low carbohydrate equation below:
    Equation 3: Use the results from steps 1-2 to calculate the amount of the main nutrient (in g/day).
    The values for TER are the ones you calculated in STEP 1, the ones for FAT and CHO are in grams per day from STEP 2. Since you've already determined the input values on an individual basis, the equations are identical for man and woman, fat or thin, athletic or sedentary people.

    So, assuming we'd chosen the standard approach for our two previously cited clients with a weight maintenance high carbohydrate diet (intake at TER) for the female and a restricted diet for the obese guy (TER - 30% = 2292.62 kcal/day), we would end up with...
    • Obese man - low carbohydrate approach, maximal carbohydrate intake 50g (because he's very insulin resistant), protein intake at 1.2 g/kg (=210g total per day | we use the lowest value, because due to his extreme body weight even that will get us way beyond the ~30g/meal rule).
      Figure 1: Results of the macro calculation for the obese man. Percentages expressed rel. to total macro intake (in g | left) and rel. to total energy intake (in kcal | right).
      With these values we would get a fat intake of 132.14 g/day and if we do the math on all macros we get a macro ratio of roughly 34% / 54% / 13% as FAT / PRO / CHO g/total macro intake per day. Usually, though, you see this expressed relative to the energy equivalents. In this case that's 53% / 38% / 9% as FAT / PRO / CHO and it gives you a much better idea of the fact that fat is the main energy source, here.
    • Active woman - high carbohydrate approach (because she doesn't like fat), maximal fat intake 45g (on the lower side, because her TER is relatively low, protein intake at 1.5g/kg (=87 g, that's minimally below the 30g/meal rule, but using a higher value would reduce her CHO intake to levels that have her run largely on gluconeogenesis which is bad for everyone and particularly nasty for women whose endocrine system tanks easily); in order not to starve her, we also assume a more realistic TER of 1,250kcal/day.
      Figure 1: Results of the macro calculation for the active women. Percentages expressed rel. to total macro intake (in g | left) and rel. to total energy intake (in kcal | right).
      If we enter these values into Equation 3, we get a carbohydrate intake of 124.25 g/day. If we do the math, just like we did for our other example client, that's a macro ratio of roughly 17.6% / 34.0% / 48.5% FAT / PRO / CHO in g/total macro intake per day and 32% / 28% / 40% FAT / PRO /CHO if the macronutrients are converted to energy equivalents and expressed relative to the total energy intake per day.
    That's it... well, you obviously you will have to tweak some of the input values, e.g. the protein intake or the baseline intakes for carbohydrates and fats if you are not happy with the results, but as I said this is an easy and proven way to get an idea of what your macros or the macros of one of your clients may look line. With some experience and a good knowledge of what works for you or a client you can optimize the result pretty quickly, though.
If you assume that the amount of food you or a client eats is way too little, because you, he or she have been dieting or even developed an eating disorder, here are additional ways to estimate the real energy requirement and to get yourself, him or her back on track. I have to warn you, though, this will be a tough time for everyone involved | read more
Let's recap what you do: (1) Know your energy intake goal, which is either the total energy requirement (TER) for weight maintenance or a figure a bit above or significantly below this value - depending on whether the goal is weight gain (higher number) or fat loss (lower number). I also highly recommend you get this number based on a food log (!), not some dubious calculation and if you still choose the latter use your brains and check whether the numbers can be accurate (in our example they obviously ain't). (2) Decide on a high carbohydrate, low carbohydrate or ketogenic approach and pick the right baselines based on weight and the ranges provided in this article. (3) Calculate the intake of the "main nutrient", i.e. FAT on low carbohydrate or CHO on high carbohydrate diets, with Equation 3 - that's it!

(*) Well, unless you feel you have to tweak the result, which is often necessary if you're dealing with people who are "extreme" as in "extremely lean / muscular", "extremely active" or "extremely overweight". In that, I suggest you keep in mind that...
  • ideally, you want to have enough protein in your diet to make sure that there's room for at least three meals with 30g or more of high EAA protein in them across the day, irrespective of what your or your clients goal is (unless it's becoming a fat slob obviously),
  • it may be a bad idea to go much lower than 50% of your or your clients body weight in grams on fats (i.e. don't go below 50g for a 100kg client), because if there's almost no fat in one's diet, the skin, the endocrine system and the overall health are going to deteriorate over time,
  • that you should avoid making protein the major source of energy in the diet; while it's good to have plenty of protein, a diet that has virtually no carbs and no fats will make the liver work overtime and convert most of the protein to glucose that's not sustainable in the long run and a fast-track to fatigue for most people (Note: all the high protein studies showing magnificent results still have large amounts of the "energy macros" fats and carbohydrate in the diet, in the impressive study by Antonio et al. (2014), for example the carbohydrate intake was way beyond 200g and the fat intake was somewhere between 50-100g). 
Alright, I suspect reading this article took you way more than two minutes. Keep in mind, though, the two minutes I speak about in the headline are for setting up your macros; and now that you've read and hopefully understood how this works, it shouldn't take you much longer than he previously advertised two minutes to get to a baseline FAT / PRO / CHO value. If you still have questions or comments, there's plenty of space for everything to discuss them on Facebook!
References:
  • Antonio, Jose, et al. "The effects of consuming a high protein diet (4.4 g/kg/d) on body composition in resistance-trained individuals." Journal of the International Society of Sports Nutrition 11.1 (2014): 19.

Anti-Microbial Effects of Artificial Sweeteners in Humans - 2/3rds of a Can of Diet Coke May Have a Sign. Effect on the Gut Microbiome, but the Relevance is Questionable

$
0
0
2/3 of this can may suffice to make a difference. Whether this difference is (a) relevant or (b) irrelevant is yet as questionable as whether the changes the scientists observed will (i) have a negative (ii) a positive or (iii) no effect.
As a SuppVersity user you know that the whole craze about aspartam and sucralose is overblown. You will also know that any potential "pro-insulinogenic" effects occurred only in less than a handful of human studies. If they did, though, they occurred in response to the ingestion of artificial sweeteners and glucose or other insulinogenic carbohydrate sources (learn more). Against that background it's also not surprising that in clinical trials vs. observational bogus, artificial sweeteners have been shown to help people with weight problems lose body fat (learn more).

The one thing about the myth of the bad sweetener that has yet not been completely debunked, though, revolves around their negative effects on the human gut microbiome.
You can learn more about the gut & your health at the SuppVersity

Bugs Dictate What You Crave

Sweeteners & Your Gut

Foods, Not Ma- cros for the Gut

Lactulose For Gut & Health

Probiotics Don't Cut Body Fat

The Macrobiotic MaPi2.0 Diet
You will remember from my previous post on this topic that - as (unfortunately) usual - all empirically valid data we have is based on rodent trials. In our mammalian cousins, the consumption of artificially sweetened products on top of an obesogenic diet has in fact been shown to have an additional effect on the modulation of the gut bacteria that appears to make turn an already "bad" diet into a nightmare (learn more). It is yet still very questionable, which part of the research can be translated to humans and to which subgroup of the population this would apply. Even if we assume a 1:1 translation from rodent to human, we would after all have to exclude most of you, because none of you will be consuming a hypercaloric, hyper-processed high fat + high carbohydrate diet (at least that's what I'd hope).

If we trust the results of a soon-to-be-published observational study from the George Mason University, though, our gut microbiomes could be in danger - although no one knows for sure.
Sweeteners, pre- and probiotics are not the only foods / supplements that can have a major impact on the bacterial ecosystem in your gut. Only recently scientists have found that the ergogenic effects of glutamine may also be mediated by the gut | more
Why do you have to care about the microbes in your gut? The good guys produce vitamins like vitamin K for you, they digest resistant starches and produce short-chain fatty acids which in are have beneficial effects on your intestine, your satiety and directly or indirectly even on your glucose control. There is unfortunately no way to really tell the good from the bad guys. At the moment, it would seem as if the lactobacilli and bifidobacteria would be the ones you want to have most. On the other hand, the number of bacteria cells in our gut surpasses the number of cells in our body and form a very complex and vurnerable ecosystem, where too much of one and too little of another species may be more of a problem than "having the wrong bacteria". For now, however, supplements containing various strains of the two aforementioned types of bacteria does in fact seem to be the most promising, but certainly not fully proven strategy to improve ones gastro-intestinal health.

Even if the good guys are unconditionally good, the ambiguous results of pertinent research clearly indicates that this doesn't imply that all of use will benefit from exogenous provisions of bacteria. There are for example both positive and negative associations for certain strains of bifidobacterium or lactobacillus species (Million. 2011), so that supplementation is mostly based on guessing which are good based on individual studies. This is also why I personally believe that tweaking the environment and thus steering the gut microbiome into the right direction with prebiotics, is a more viable and promising strategy than the ingestion of bazillions of preformed bacteria aka probiotics.
In their thorough, but small scale (N=31) analysis, Cara L. Frankenfeld and her colleagues analysed the fecal sample of their subjects using Multitag Pyrosequencing. This allowed them to compare the bacterial abundance and bacterial diversityacross consumers and non-consumers of aspartame and acesulfame-K using non-parametric statistics and UniFrac analysis, respectively.

To predict some of the consequences of possible difference in the bacterial make-up Frankenfeld et al. applied a phylogenetic investigation of the communities by reconstruction of unobserved states (PICRUSt) in order to predict mean relative abundance of gene function.
Table 1: There were no sign. differences in BMI, energy intake, total carbohydrate and added sugar intake or the "quality" of the diet (as assessed on the Healthy Eating Index) between AS consumers and non-consumers (Frankenfeld. 2015)
Thus, the results of the gene function analysis must be met with a healthy degree of skepticism, because unlike the bacterial counts and diversity, which was also just estimated based on what "left" the subjects in form of feces, the gene assay is a model-based result... think of it like the weather forecast, one of which studies say it's relatively reliable (Langille. 2013).
Don't be a fool, stevia will mess with your microbiome just like if not even more than "unnatural" sweeteners.
Sweeteners could be a bad, but also a good thing. In pigs, SUCRAM® (a mixture of saccharin and neohesperidin dihydrochalcone) will significantly increase the abundance of the allegedly good Lactobacilli by more than 100% (Daly. 2014). In other studies, like the previously discussed study in rodents, saccharin has a negative effect. Whether a 100% increase in Lactobacilli as in Daly et al. (2014) or decreases in other bacteria as they have been observed in several rodent studies is something we'd want or not, is yet totally unknown. It's simply too early to predict the effect. For many of you that may be enough to avoid sweeteners, and I fully understand that.

I just want you to know that stevia is not the "healthy alternative", just because it's "natural". In fact, for stevia we even know that it will kill lactobacilli, i.e. those bacteria of which we think that they are the good guys (learn more about how stevia messes with the gut micriobome).
Among the seven aspartame consumers and seven acesulfame-K consumers (some consumed both), the researchers did indeed find some significant differences in the bacterial make-up compared to those subjects who had abstained from consuming sweeteners in the four days before the fecal samples were collected. I quote from the FT (Frankenfeld. 2015):
  • Bacteriodetes and Firmicutes had the highest median abundances and together accounted for the majority of the bacterial class representation in all individuals. 
  • The median Bacteriodetes:Firmcutes ratio did not significantly differ across aspartame non-consumers (0.96, range: 0.15-2.97) and consumers (1.08, range: 0.69-1.87), (median test p-value=0.60). 
  • There was no overall visual clustering of individuals by acesulfame-K consumption . 
  • Overall bacterial diversity evaluated with UniFrac analysis was different across consumers and non-consumers, but there were no significant differences in relative abundance of gene function across consumers and non-consumers (Figure 3).
  • There were no observable difference in the three individuals who consumed both aspartame and acesulfame-K (Supplemental Figure 1). 
So, let's briefly sum this up. In line with the overall hysteria about sweeteners, the changes were more significant in the aspartame group (p<0.01) than they were in the acesulfame-K group (p=0.03), but this could be explained by the simple fact that the subjects consumed significantly more aspartame (one can of diet coke contains 150mg, by the way) than acesulfam-K (5.3 mg/day to 112 mg/day vs. 1.7 mg/day to 33.2 mg/day).
Figure 1: Yes, there were differences in the bacterial make-up of the gut microbiome of the four groups, but no one can tell you what these or the vast individual differences in the groups mean for your health (Frankenfeld. 2015) !
Against that background, the "aspartame is the worst" hypothesis could neither be refuted nor supported based on the study at hand, even if the results would signify overall ill-health effects. With all three potentially important markers remaining unchanged, though, this is not the case:
  • the ratio of mostly "bad" gram-negative bacteriodetes and "good" gram positive bacteria remained the same - it's thus hard to argue that the subjects who consumed artificial sweeteners had an unhealthier gut microbiome
  • there was no general reduction in gut bacteria, which would indicate a general anti-microbial effect of artificial sweeteners as it occurs with antibiotics - it's thus hard to argue that the anti-microbial effects (which don't exist) of artificial sweeteners would leave you similarly defenseless and open to colonization with "bad" bacteria as antibiotics.
  • the gene essays say that despite the differences in the numbers of certain bacteria, the gene expression is the same - it's thus hard to argue that there was an epigenetic effect of artificial sweeteners that precipitates us to obesity or even makes us sick / diabetic / whatever
Against that background, there may be an urgent need for future research and technological development that would allow us to go beyond observing changes in the number and ratio of largely unknown gut bacteria that are (as of now) completely meaningless for us. 
Probiotics Inhibit Ill-Health Effects of 7-Day Overfeeding in Man - Does This Make Yakult(R) the Perfect Tool in Your Bulking Toolbox or is it Just Another Marketing Gag? Learn more!
Don't be fooled! Scientists may understand the format of the graph in Figure 1 better, but if they were honest, they would have to admit that they have absolutely no clue what the changes they observed mean. Yes, they can use mathematics to tell you they are statistically significant, but they can't even tell you whether they're rather good or bad for you.

Eventually, the data in Figure 1 shows us only one thing: The gut microbiome is like a finger-print. It's different for all of us and despite changes due to artificial sweetener consumption, there's no clear pattern in any of the artificial sweetener groups that would allow us to predict negative or positive effects based on what we know now.

Against that background I would try not to freak out about the fact that aspartame and acesulfam-k can affect your gut microbiome. There is no, and I repeat, no convincing experimental evidence in humans that would remotely confirm that any potential changes of the gut microbiome that occur in response to the consumption of artificial sweeteners would entail ill health effects. The only thing we have,are observational and epidemiological studies that correlate obesity with artificial sweetener use and are abused by people who don't know or simply ignore the difference between associations and causation as "proof" that artificial sweeteners are (usually together with fructose) at the heart of the obesity epidemic. And even in the study at hand, the dietary control was not rigorous enough to exclude that the observed association was actually due to aspartame and acesulfam-K and not due to other agents in the artificially sweetened drinks or totally different foods, the subjects consumed during the four day lead-in, during the last months, or even chronically for years or decades | Comment on Facebook!
References:
  • Daly, Kristian, et al. "Dietary supplementation with lactose or artificial sweetener enhances swine gut Lactobacillus population abundance." British Journal of Nutrition 111.S1 (2014): S30-S35.
  • Frankenfeld, Cara L., et al. "High-intensity sweetener consumption and gut microbiome content and predicted gene function in a cross-sectional study of adults in the United States." Annals of Epidemiology (2015).
  • Langille, Morgan GI, et al. "Predictive functional profiling of microbial communities using 16S rRNA marker gene sequences." Nature biotechnology 31.9 (2013): 814-821.
  • Million, M., et al. "Obesity-associated gut microbiota is enriched in Lactobacillus reuteri and depleted in Bifidobacterium animalis and Methanobrevibacter smithii." International journal of obesity 36.6 (2012): 817-825.

No Additional Gains With PWO Protein + Leucine Shakes in Rookies? Why the "Shocking" Results of a Recent Study Don't Mean That They, Let Alone You, Cannot Benefit at All

$
0
0
You can't expect wonders from protein supplements... no matter, when you take them, by the way. But I wouldn't mark them down as useless - even for rookies - based on the study at hand.
When I look at the 14 year old kids who need an written permission from their mum to train at the gym buying protein tons o powders and dozens of bars from the vending machines at the gym, even I have to shake my head. Not necessarily, because they're buying those products, but rather about what they tell each other about the effects: "Yo,... recently I ate this protein bar right after my workout and I felt swole for day..."

Now, you know that I am into supplement psychology and have no doubt about the fact that said kiddo felt swole all day, but we all know that protein is in no way a supplement the muscle-building and strength advantages of which will show within hours. And with that, I have a perfect transition to today's topic: The recent study from University of Central Florida in Orlando (Boone. 2015).
You can learn more about protein intake at the SuppVersity

Are You Protein Wheysting?

5x More Than the FDA Allows!

More Protein ≠ More Satiety

Protein: Food or Supplement?

Protein Timing DOES Matter!

Less Fat, More Muscle!
You will probably remember the most striking result of this study in which Carleigh H. Boone and colleagues "examine[d] the short-term effect of resistance training with and without protein supplementation on changes in muscle morphology and strength in untrained young men" (Boone. 2015).

Some of you may now be wondering: Why on earth do they even test that? We have ample evidence that protein supplements are powerful muscle builders! And you are right, but as it is the case for (almost) every research question in exercise science, even the highly acclaimed benefits of pre- or post-workout protein supplementation are somewhat contested. There's the evidence that supports the benefits of peri-workout protein supplementation on exercise induced muscle gains. Unfortunately, many of these studies may have been over-interpreted. Why?

FSR ≠ more muscle. Just because the post-exercise fractional protein synthesis increases this does not mean that you will gain more muscle in the long term. Check out this SV Classic to learn why!
Well, many of the often-cited studies in rookies, like Biolo et al. (1995), Phillips et al. (1997), or Tipton et al. (1999), measured increases in acute muscle protein synthesis and markers of anabolism. Due to their short design, however, increased long-term gains could only be predict, but not detect. In my 2014 article "Study Confirms: Acute Post-Exercise Myofibrillar Protein Synthesis Is Not Correlated with Resistance Training-Induced Muscle Hypertrophy in Young Men" (read more) you have learned, though, that the assumption that significant increases in post-workout muscle protein synthesis will necessary lead to significant augmented increases in muscle size in the long run is logical. but futile.

There are studies where this is the case, e.g. Coburn et al. (2006); Hulmi et al. (2010); Walker et al. (2009); Willoughby et al. (2007) - in both, trained and untrained individuals, but as Boone et al. rightly point out, there are also studies by Antonio et al. (2000) or Hoffman et al. (2009) in which protein or amino acid supplements had no beneficial effects on muscle or strength gains in either or trained and untrained individuals. The randomized, double-blinded study Boone et al. (2015) conducted is thus by no means superfluous. It is yet no perfect either, because with a length of only our week, the scientists picked exactly the time-frame in which things, or I should say "gains" happen faster than you can measure them. Furthermore, the use o a lower body unilateral resistance training makes it very difficult to infer the effects of protein supplementation on (a) muscle morphology [cross-sectional area, muscle thickness, pennation angle], (b) lower body power output, (c) maximal dynamic strength, and (d) maximal isometric strength in other muscle groups and in response to an overall metabolically more demanding workout.
Protein Timing Does Matter! Yet Only in Trained Men. More Than 2x Higher Relative Protein Retention W/ Immedi-ate vs. 6h Post Whey Consumption in Bodybuilders vs. Rookies | read more
Why does trained vs. untrained matter? We know that the growth stimulus in response to exercise and the unused growth potential are both maximal in untrained individuals. As far as strength is concerned, they have the additional advantage of making rapid gains by learning to master the exercises properly and neurological adaptations which are for the most part responsible for the rapid strength increases in the first months of resistance training. It is thus only logical that there's evidence that rookies do in fact gain "no matter what", while advanced trainees will have to up their game by advanced training techniques, protein supplementation and as I pointed out in a 2014 article, here at the SuppVersity even protein timing, which appear to be pretty useless for the people who have just been picking up the bar- and dumbbells.
Since the scientists have concise dietary records (Figure 1) and used a supplementation regimen that included not just 17g of whey protein concentrate, but also 3g of cholostrum and an extra 2g of leucine (PLA was an iso-caloric amount of resistant maltodextrin) to trigger a maximal increase in protein synthesis when the shake was consumed ad-libitum (in this case whenever the subjects wanted) on non-training days and immediately after the training sessions on training days, the data is still worth discussing (also because I already mentioned it on Facebook and I don't want you to over-estimate the overall significance of the study).
Figure 1: Overview of the macronutrient (in g) composition of the subjects' diets at baseline and during the study (the value for protein include the amount of protein from the protein shake in the PRO group | Boone. 2015).
As you can see in Figure 1 the protein intake of the twenty untrained young men who were randomly assigned to either a resistance training + protein (PRO; 21.4 ± 1.9y, 75.3 ± 15.7kg) or resistance training + placebo (PLA; 22.9 ± 3.1y, 76.8 ± 14.4kg) group was almost identical at baseline (1.2g/kg) and increased from 1.2 to 1.3g/kg in the protein group (+18.2%) while it dropped to 1.0g/kg body weight in the placebo group (-17.1%).

No such differences existed with respect to the supervised resistance training programs which started with five minutes of non-fatiguing aerobic activity on a cycle ergometer at a self-selected resistance and cadence. This was followed by a specific warm-up consisting of body weight squats, alternating lunges, walking knee hugs, and glute kicks (10 each). The subsequent, actual training sessions is described as follows.
"Each training session consisted of unilateral countermovement jumps (CMJ), leg press (LP), and leg extension (LE) using the dominant leg. CMJ were performed for a total of three sets of 8 repetitions with maximal effort. The LP and LE exercises were performed for a total of three sets of 8-10 repetitions at 80% of the participant’s previously determined 1RM with 90 seconds allotted between sets and exercises. If a participant was unable to perform the minimum amount of repetitions during the first or second sets of LP or LE, weight was decreased to an intensity deemed appropriate by a certified trainer. Consequently, if the participant was able to perform all repetitions with proper form and minimal strain, weights were progressively increased during the subsequent training session at the certified trainer’s discretion" (Boone. 2015).
After twelve of these training sessions, which took place at the university’s Strength and Conditioning Lab, on three nonconsecutive days per week.
Why would it have been nice to know when the size and power gains were measured? The answer is "the pump", ... well, not exactly. It's rather the cell swelling that occurs in the hours and days after a workout. The latter may have increased the overall impression of size gains and thus reduced the significance of potential differences if there was not a interval of at least 5 better 7 days between the last workout and the measurement of the muscle sizes. Bullocks?
Working out leads to increases in water content (left) corresponding increases in muscle "size" (right) at the 10 & 20 cm measuring points of the the quads; all values expressed as relative changes (%) vs. baseline | more
No, reread my 2014 article "Cell Swelling Keeps Muscles "Pumped" For More Than 52h. Size Increases of Up to 16% After a Single Leg Workout! Plus: Changes in Tendon Water & Collagen Content" (read the full SV-Classic article)- that the data will be distorted is a proven fact, with just one study investigating the extent, though, we cannot tell if the data will always be 16% off and the difference thus practically relevant.

Another reason why I was specifically looking for information on the interval between the last training and testing sessions was the lack of increases in peak and mean power (the changes in Figure 2 are all non-significant). If we know when the testing was done, one may be able to tell if this was a result of residual fatigue or if there were in fact no power gains in any of the two groups.
I've plotted the size, strength and power gains, which were assessed on an unfortunately non-disclosed time (see box above for elaborations) in Figure 2:
Figure 2: While even the small size gain in the rect. femoris in the PRO group was stat. sign. compared to the pre-value, none of the visible differences between PRO and PLA reached stat. significance and the mean and peak power did not even change at all... well, statistically speaking (see box above for a discussion why this may be the case | Boon. 2015)
Now, it's not like there were no gains, the cross-sectional area and muscle thickness increased significantly, but the scientists observed neither statistically nor practically significant (mostly due to the large inter-individual differences, e.g. a standard deviation of +/-12% for the CSA increase of the Rectus Femoris in the PRO group).
Table 1: Changes in maximal dynamic, isometric, and specific strength following training - Values are means ± SD. * Significant change from Pre to Post (p < 0.05 | Boone. 2015).
Since the strength data in Table 1 is similarly inconclusive, there is little doubt that is - for the study at hand - 100% warranted to say that while "the current findings suggest that short-term resistance training resulted in significant increases in muscle strength and size in untrained young men", they also suggest that "[t]he addition of a post-exercise protein supplement used in the current investigation was not sufficient to enhance the effect of resistance training" (Boone. 2015).
Polydextrose and Resistant Malto-dextrin May be Useful Dieting Aids, But are They good Placebos?
So what? Don't dumb your protein supplements, yet ;-) Aside from the previously mentioned study duration and the unrealistic training regimen, there is another thing I would like to highlight to substantiate my previously voiced warning that you should not overestimate the practical significance of the study at hand: The "placebo" supplement. Usually you'll see that protein is tested against regular maltodextrin. In the study at hand, however, it was tested against resistant maltodextrin of which you, as a SuppVersity reader know that it has been shown to significantly curb the appetite in humans and rodents. More recently, Hira et al. (2015) calculated that only 10g of these resistant starches per day may be able to reduce the energy intake by a whopping 7%.

This puts the -9.4% reduction in energy intake in the placebo group into an altogether different light and makes me question whether the placebo was as inactive as it should be. I have to admit, though, that eventually a lower total protein intake and a lower total energy intake as it was observed in the PLA group at identical study outcomes would even substantiate the claim that additional protein is useless in rookies, but who knows which other unknown effects the 20g of the resistant maltodextrin "placebo" had ;-)

Enough of the speculations, though. Let's stick to the facts: (1) Very few of you will be in the first four weeks of their resistance training "career", (2) even fewer of you will train only one leg, and I'd hope that (3) none of you plan to train for only the next for weeks only. So, that alone would make me want to repeat the scientists' own suggestion that "more research needs to be done" while telling you to (a) keep the results of this study in mind and file them under "protein is no wonder drug", while (b) keep taking your protein supplements. There's good enough evidence to say that >90% of you are going to benefit in one area or another - and always remember whey is more than a muscle builder (learn more) | Comment on Facebook!
References:
  • Antonio, Jose, et al. "Effects of exercise training and amino-acid supplementation on body composition and physical performance in untrained women." Nutrition 16.11 (2000): 1043-1046.
  • Biolo, Gianni, et al. "Increased rates of muscle protein turnover and amino acid transport after resistance exercise in humans." American Journal of Physiology-Endocrinology And Metabolism 268.3 (1995): E514-E520.
  • Coburn, Jared W., et al. "Effects of leucine and whey protein supplementation during eight weeks of unilateral resistance training." The Journal of Strength & Conditioning Research 20.2 (2006): 284-291.
  • Boone, Carleigh H., et al. "Muscle strength and hypertrophy occur independently of protein supplementation during short-term resistance training in untrained men." Applied Physiology, Nutrition, and Metabolism ja.
  • Hira, Tohru, et al. "Resistant maltodextrin promotes fasting glucagon-like peptide-1 secretion and production together with glucose tolerance in rats." British Journal of Nutrition (2015): 1-9.
  • Hoffman, Jay R., et al. "Effect of protein-supplement timing on strength, power, and body-composition changes in resistance-trained men." International journal of sport nutrition 19.2 (2009): 172.
  • Hulmi, Juha J., Christopher M. Lockwood, and Jeffrey R. Stout. "Review Effect of protein/essential amino acids and resistance training on skeletal muscle hypertrophy: A case for whey protein." Nutrition & metabolism 7 (2010): 51.
  • Phillips, Stuart M., et al. "Mixed muscle protein synthesis and breakdown after resistance exercise in humans." American Journal of Physiology-Endocrinology And Metabolism 273.1 (1997): E99-E107.
  • Walker, Thomas B., Et Al. The Influence Of 8-Weeks Of Whey Protein And Leucine Supplementation On Physical And Cognitive Performance. Air Force Research Lab Brooks Afb Tx Human Effectiveness Directorate, 2009.
  • Willoughby, D. S., J. R. Stout, and C. D. Wilborn. "Effects of resistance training and protein plus amino acid supplementation on muscle anabolism, mass, and strength." Amino acids 32.4 (2007): 467-477.

Nutrition Research Update: Stem Cell Treatment For Type II Diabetes, Probiotics and Weight Loss Reviewed (Twice) and D-Xylose Sweet Poison for Superfluous Body Fat

$
0
0
With the right diet and lifestyle, stem cell treatments, probiotic supplements or xylose-laden "functional foods" wouldn't be necessary in the first place.
You're probably used to it, but I am in the mood for bragging: The SuppVersity is where you'll read about the latest nutrition, exercise and supplement related studies first. In research updates like the one today, I am trying to provide a little more information than in the SV Facebook News, though, where I usually stick only to the main results of studies that have just been published or at least accepted for publication.

In today's installment of what I often call the "Short News", I will discuss three papers that are going to be published in one of the next issues of the peer-reviewed scientific journal Nutrition News.

Studies dealing with a pre-clinical, but promising stem cell therapy for diabetics, the verdict on probiotic supplements (including my evaluation of the scientists' verdict ;-) for weight loss and an update on the effects of the xylitol precursor d-xylose and its effect on mammalian fat cells in vivo.
Read older short news and true or false article at www.suppversity.com:

Pasta "Al Dente" = Anti-Diabetic

Vinegar & Gums for Weight Loss

Teflon Pans Will Kill You!

Yohimbine Burns Stubborn Fat

You Can Wash Pesticides Away

Milk = Poisonous Hormone Cocktail
  • Stem Cells as Diabetes Treatment (Xing. 2015) - In software development you'd probably call the latest study from the Cangzhou City Central Hospital an "early alpha version" of an intriguing new way of treating type II diabetes.

    In their latest rodent study, Baoheng Xing et al. build on previous experiments in which pancreatic progenitors derived from human embryonic stem cells were shown to be able to effectively treat diabetes in mice (Kroon. 2008). In their study, however, Xing et al. went one step further and developed a system for treating diabetes using human embryonic stem cell–derived pancreatic endoderm in a mouse model of gestational diabetes mellitus.
    Figure 1: Glucose (a), insulin (b) and body weight (c) levels of wild type (wt) and treated (db/+PE) vs. untreated (db/+) pregnant mice before and during gestation, as well as Kaplan-Meier survival curves of litters show significant improvement right into the normal range in response to treatment (Xing. 2015)
    To this ends, the researchers had human embryonic stem cells differentiate in vitro into pancreatic endoderm, which were then transplanted into db/+ mice suffering from gestational diabetes mellitus.

    As the data in Figure 1 goes to show you, the transplant, of which the researchers expect that it could be used in humans, too, greatly improved the glucose metabolism and reproductive outcome of the treated female rats compared with the control groups. With their results Xing et al. do thus contribute to the growing evidence that diabetes may (sooner or later) be a "curable" disease when we are eventually mastering the use of differentiated human embryonic stem cells for treating general and gestational diabetes mellitus patients.
  • Probiotics and weight loss - reviewed (Park. 2015): What's the verdict? You will remember that I am still skeptical with respect to the real world benefits of the new en-vogue supplements that contain billions of life or dead bacteria and promise benefits from increased gut health to... you guessed it, the most marketable of all benefits: weight loss!

    A recent systematic review by scientists from the Hoseo University and the Keimyung University in Korea presents the first attempt to summarize and critically evaluate the evidence from clinical trials that have tested the effectiveness of probiotics or foods containing probiotics as a treatment for weight loss. Literature searches of electronic databases such as PubMed, Cochrane Library, and EMBASE were conducted. Methodological quality was assessed using body weight and body mass index (BMI). Initial searches yielded 368 articles. Of these, only 9 met the selection criteria. Because of insufficient data, only 4 of the studies were randomized controlled trials (RCTs) that compared the therapeutic efficacy of probiotics with placebo.

    As my skepticism would have made me believe, the meta-analysis of these data showed no significant effect of probiotics on body weight and BMI (body weight, n = 196; mean difference, −1.77; 95% confidence interval, −4.84 to 1.29; P = .26; BMI, n = 154; mean difference, 0.77; 95% confidence interval, −0.24 to 1.78; P = .14).
    Figure 3: It's not like there were no benefits. You just have to look at the right parameters to see them. Studies like Kadooka et al. show that the effects on BMI are small compared to those on metabolically more relevant markers like total fat mass, waist circumference and visceral fat (Kadooka. 2015).
    That does not mean that there are no benefits at all, though. I reviewed the few studies that measured not just body weight and BMI, but also the subjects' body fat levels. This is an important difference, because a focus on BMI ignores potentially health relevant changes in body composition. Changes as they were observed by Kadooka et al. (2013; see Figure 3), for example, who found a significant time x group differences for visceral fat, fat percentage, fat mass, and waist circumference with much less pronounced effects on BMI (too low to influence the result of a systematic review significantly) in their 12-week study. In this context, it is also worth mentioning that Sanchez et al. (2014) observed a significant beneficial effect in obese women (but not man) for whom the consumption of 1.6 × 10^8 colony-forming units of LPR/capsule with oligofructose and inulin made it significantly easier to maintain their body weight after a weight loss intervention. Another benefit that must not be ignored.
A lot of choline and potassium, but also a significant amount of fiber, this simple meal has everything US and other inhabitants of the Westernized fast food world don't get enough of - so why even bother w/ supplements if your diet can have it all? | more
Scrape the probiotics grab the prebiotics: Unlike for probiotics, the evidence for the weight management benefits of various prebiotics (fiber that feeds the bacteria in your gut) is more promising. One has to be careful wrt to making overgeneralized statements based on evidence that has been generated with specific types of fiber, even though probiotic fiber has more to offer than just a weight loss effect: Improvements in blood pressure, blood glucose management and blood lipids are only three additional items on the "benefits of increased fiber intake"-list. Moreover, fiber is one of the nutrients for which westerners are at the highest risk of not getting enough in their fast food diets (learn more) if you want so supplement, "supplement" high fiber foods.
  • Overall, I still feel obliged to repeat what I wrote in my recent article on the effects of sweeteners on the microbiome: We still have to learn very much about the effects of probiotics in general and individual types of gut bacteria, in particular, before we can actually give good strain-specific supplement recommendations. It's after all possible that the same strains that work in the obese subjects of studies like Kadooka (2015) won't work or even do the opposite in lean individuals.
  • D-Xylose Exerts Epigenetic Anti-Obesity Effects and Stops Fat Cell Growth (Lim. 2015) - Yes, this is not the first study to show that the provision of D-Xylitol or, as in the case of a 2011 study by Amo,et al., its cousin and "artificial sweetener" xylitol can reduce the weight gain due to obesogenic diets. What makes it interesting, though, is that it involved two different, relatively low dosages of D-xylitol as they could easily be added to our own food chain.
    Figure 4: While the effects on body weight and fat gain were significant, the differences (expressed relative to the rodents on regular chow) are still significant, so even if you replace 5-10% of the sugar in your junkfood diet with the low calorie sweetener (2.4kcal/g), you will get fat. If anything it may completely prevent the increase in liver fat - albeit only if the dosage is high enough and the effects are identical in humans (data from Lim. 2015)
    With only 5% and 10% of the sucrose content of the high fat chow of the rodents in Lim et al.'s latest study being replaced by D-Xylose, the scientists observed
    • significant reductions in weight and more importantly fat gain
    • significant reductions in hepatic steatosis (NAFLD),
    • a reduction of the genes that are responsible for the storage of fat to normal (5%) and sub-normal (10% D-Xylose) levels, and
    • significant reductions in total cholesterol and low-density lipoprotein cholesterol, low-/high-density lipoprotein, and the important total cholesterol/high-density lipoprotein ratio.
    In view of the fact that replacing just a relatively small amount of sucrose in our diet with D-Xylose (and probably xylitol) can ameliorate the weight and adipose tissue gain, normalize blood glucose levels and blood lipid profiles and lower the lipid accumulation in the liver by "regulating expression of lipogenesis- and β-oxidation–related genes" (Lim. 2015), it is probably actually warranted to speculate, just like Lim et al., about a "possible application of d-xylose as a dietary supplement for the prevention of obesity-related metabolic disorders" (Lim. 2015) - even though clinical human trials are still warranted.
My recent article on "Getting Your Macros Straight" may help you improve your diet | learn more 
Bottom line: In spite of the fact that new developments like those discussed above are both exciting and promising, an active lifestyle and a largely unprocessed whole-foods high(er) protein lowe(er -/ compared to the current) carbohydrate diet that derives the lion's share of its fats from low(er) omega-6 foods, olive and other high MUFA oils, alone, would be enough to maintain healthy blood sugar and lipid, as well as body fat levels for most of us.

I mean, if you don't get fat in the first place, you don't have to take probiotic supplements or use stem cell therapy to handle or undo the damage you've done... right? | Comment!
References:
  • Amo, Kikuko, et al. "Effects of xylitol on metabolic parameters and visceral fat accumulation." Journal of clinical biochemistry and nutrition 49.1 (2011): 1.
  • Kadooka, Yukio, et al. "Effect of Lactobacillus gasseri SBT2055 in fermented milk on abdominal adiposity in adults in a randomised controlled trial." British Journal of Nutrition 110.09 (2013): 1696-1703.
  • Kroon, Evert, et al. "Pancreatic endoderm derived from human embryonic stem cells generates glucose-responsive insulin-secreting cells in vivo." Nature biotechnology 26.4 (2008): 443-452.
  • Lim, Eunjin, et al. "d-Xylose suppresses adipogenesis and regulates lipid metabolism genes in high-fat diet–induced obese mice." Nutrition Research (2015).
  • Park, Sunmin, and Ji-Hyun Bae. "Probiotics for Weight Loss: A Systematic Review and Meta-Analysis." Nutrition Research (2015).
  • Sanchez, Marina, et al. "Effect of Lactobacillus rhamnosus CGMCC1. 3724 supplementation on weight loss and maintenance in obese men and women." Br J Nutr 111.8 (2014): 1507-19.
  • Xing, Baoheng, et al. "Human embryonic stem cell-derived pancreatic endoderm alleviates diabetic pathology and improves reproductive outcome in C57BL/KsJ-Lepdb/+ gestational diabetes mellitus mice." Nutrition Research (2015).

ALA, Berberine, Metformin, Resveratrol, AICAR & Co - Are AMPK Mimetics & Activators Good or Bad for Athletes?

$
0
0
Unless you're planning to just sit, instead of cycle on your spinning bike, it is by no means sure if your performance well benefit or maybe even suffer from the use of AMPK mimetics and activators.
Recently someone asked me on Facebook, whether AMPK activators like Lipoic acid (ALA), Berberine, Metformin, AICAR & Co wouldn't make excellent performance boosters. I pondered that question for some time and said: "If you are about to compete in a highly glycolytic sport, the opposite is probably the case."

There's little question that supplements like lipoic acid are useful if you are an overweight type II diabetic. But let's be honest: How many of you fall into this category? As healthy, active individuals or even athletes, on the other hand, you should be aware that the ability of these agents to increase the glucose uptake and block the glyconeogenic pathways in the liver may easily make you run out of fuel during anaerobic activities like lifting or sprinting.
Learn more about hormesis and how antioxidants can also impair your gains

Is Vitamin E Good for the Sedentary Slob, Only?

Even Ice-Baths Impair the Adapt. Process

Vit C+E Impair Muscle Gains in Older Men

C+E Useless or Detrimental for Healthy People

Vitamin C and Glucose Management?

Antiox. & Health Benefits Don't Correlate
This does not negate the fact that AMPK activators, by their ability to increase the use of free fatty acids as a substrate, may be of interest to endurance runners or athletes competing in other sports, where the lion's share of the energy they use during their workouts and competitions are carboxylic acids with a long aliphatic tail (chain), i.e. fatty acids.

Against that backround it is hardly surprising that the few pertinent studies that exist are - at least in parts - contradictory. Shortly before the last Olympic Games in Beijing, for example, a study was published that showed that the research chemical and AMPK activator AICAR (5-amino-1-b-D-ribofuranosyl-imidazole-4-carboxamide) increased the running capacity of mice without any training. But let's be honest: Do you think athletes would be looking for agents that work without training... well, obviously they would, but AICAR - as potent as it may be - will never replace the blood, sweat and tears athletes have to invest to be successful. That's for sure.
Which AMPK activators are actually prohibited by the WADA? The WADA list of prohibited substances lists only "AMP-activated protein kinase (AMPK), e.g. AICAR; and Peroxisome Proliferator Activated Receptor δ (PPARδ) agonists e.g. GW 1516" which is pretty unspecific and leaves me questioning whether other natural AMPK activators like ALA, berberine, chlorogenic acid or the most widely used one, i.e. metformin, would be illegal, too.
Nevertheless, the observation Narkar et al. (2008) made was enough for the World Anti-Doping Agency (WADA) to include certain AMPK activators in the list of forbidden drugs - for all, not just endurance sports, obviously.
Table 1: Adenosine monophosphate-activated kinase activators and their impact on exercise capacity (Niederberger. 2015)
Actual experimental evidence of performance enhancing effects exists for several natural and synthetic AMPK mimetics and activators (see Table 1). If you look closely, however, you will notice that all those "enhacnements" and "increases" have been in rodent models and/or non-athletes.
What does the latest review say? As usual, the special needs of Olympic-lifters, bodybuilders, sprinters and all other athletes who are competing in anaerobic sports are ignored by the authors of the latest and - as far as I know - first review of the impact of the activation of AMPK on sports performance.

It's the increase in the total time and endurance as well as VO2 in a injection only (no training) rodent study observed by Narkar et al. in 2008 that is behind all the hype around AICAR as a "potent doping agent". I wonder if the athlete who use is even know that the mice in the study didn't even train. Whether the effect is additive is thus highly questionable.
In spite of their unfortunate ignorance of sports-specific differences, Niederberger et al. (2015) produce a neat overview of the available research on AMP mimetics like AICAR, pharmacological drugs like metformin, salycilic acid, thiazolidinediones, Phenobarbital and Telmisartan, and natural AMPK activators like green tea, capsaicin, resvertrol and co. Of these, none has been tested in athletes, though, even the applauded AICAR helps only in theory (!). Unlike Niederberger's review suggests, the performance enhancing effects in studies like (Hayashi. 1998; Cuthbertson. 2007; Narkar. 2008) were after all observed in the absence of baseline training and are thus not representative of what would happen in athletes who won't be dumb enough to believe that they don't even have to train if they are abusing AICAR.

The lack of relevant evidence for performance benefits in athletes that would be induced by AMPK mimetics, as well as the existing evidence that AMPK promoters like resveratrol, which don't target AMPK primarily, but must be thought of as potent antioxidants instead, entail the risk of anti-hormetic effects (e.g. the attenuation of the positive effects of endurance exercise on inflammatory and oxidative stress markers in aged men in response to 250mg resveratrol day in Olesen et al.'s 2014 study) put a huge "?" behind the actual usefulness of AMPK mimetics and promoters as athletic performance enhancers..
In the absence of experimental evidence from both rodent and human studies that involve AMPK activators and 
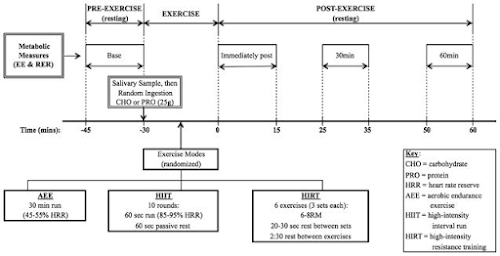
anaerobic exercise, we have to use our brains to find out whether sprinters, bodybuilders, or weight lifters and athletes competing in team sports that have both an aerobic and an anaerobic component would benefit as well. In this case the extensive research on alpha lipoic acid (ALA) can help us, but we should not forget that the effects may differ from one agent to the other.

Due to the previously mentioned potentially negative effect on blood glucose in insulin sensitive individuals that is mediated primarily by increases in whole body glucose oxidation, increased glycolysis (wasting of the glycogen reserves| Barnes. 2004) and a reduced ability to produce new glucose "on demand" (via gluconeogenesis, which is AMPKs main of glucose control according to Zhang et al. 2009), athletes competing in anaerobic sports may in fact run the risk of running low on blood sugar and thus compromising their performance and/or being even more reliant on sugary high carbohydrate beverage.
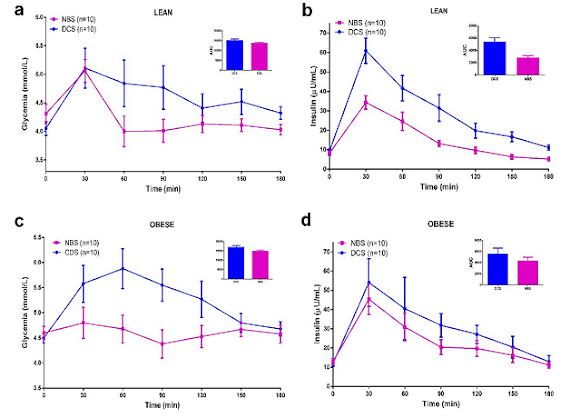
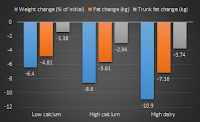
In insulin sensitive muscle cells ALA reduces the rate of glycogen synthesis (Dicter. 2002). This should remind you of this simple truth: What's good for your obese neighbor, ain't necessarily good for you. Plus: ALA ain't the only supplement with different, often opposite effects in lean vs. obese.
What's good for the obese is rarely good for athletes: The reduced protein synthesis (Figure 1) is only one of several undesirable side effects of high doses of ALA. One that people usually won't even believe exists is an impairment of glycogen synthesis in insulin sensitive skeletal muscle. While ALA is famous for partly restoring the whole body (including body fat) glucose uptake in insulin resistant individuals, studies like the one by Dicter et al. (2002) indicate that it will reduce the insulin-induced glycogen synthesis if the muscle in question is not insulin resistant, but sensitive. That's an effect that may occur only at higher dosages of ALA (and other potent AMPK activators), but still one that no athlete can ignore.
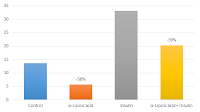
If you don't care about blood glucose, you may be intrigued to hear that AMPK will not act on your glucose metabolism, alone. Increasing levels of AMPK will also suppress skeletal muscle protein synthesis (Figure 1), which is a side effect that's probably even worse than the remote risk of hypoglycemia, specifically in athletes competing in anaerobic sports.

Figure 1: Changes in p-AMPK and nutrient-induced protein synthesis in myotubes from the EDL muscle (Saha. 2010).
Now, some of you may argue that I personally wrote in an older article in the Intermittent Fasting Series that the rise in AMPK due to exercise would not be a problem.

If you'd read that article carefully, though, you'd also know that this is because exercise triggers the release of a specific form of AMPK that's different from the one that's released during fasting and in response to regular AMPK activators. It is thus not unlikely that high(er) intakes of ALA as they would probably be abused by athletes, who (falsely) believe they'd benefit from it, can impair the protein synthesis to a similar extent as it was observed by Saha et al. in their 2010 study in rodent EDL muscles.

Furthermore animal studies show that chronic administration of albeit very high doses of ALA, equivalent to ~5g/day for a human being, will actually trigger significant reductions in lean mass (Shen. 2005) - something almost every athlete who's competing in anaerobic sports will want to avoid.
The answer to the question in the headline is - as so often: "It depends!" If you are an endurance athlete, the acute, yet not the chronic consumption of the AMPK mimetics (=acts just like) like AICAR and maybe some of the less potent AMPK activators could improve your endurance. Without studies where the rodents (or even better men and women) are actually trained, even this assumption is speculative.

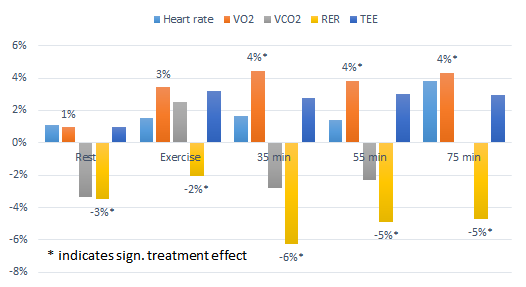
Figure 2: While the last word has not been spoken, yet the impaired adaptive response to stressors in older subjects supplementing w/ 250mg/day resveratrol Olsen et al. observed in 2014 is further evidence that the chronic consumption of potent antioxidants (which happen to be AMPK promoters in this and other cases like ALA) must not be recommended unconditionally for athletes based on the available evidence.
If, on the other hand, you're competing in sports where anaerobic performance, i.e. power, speed and other parameters that will critically depend on the availability of glucose, you will probably see no beneficial and, in the worst case, detrimental effects.

These detrimental effects could also occur in response to the chronic ingestion of AMPK promoters like lipoic acid due to their potentially negative effect on protein synthesis and glycogen repletion, as well as in response to the chronic use of potent anti-oxidants for which evidence exists that they impair the hormetic response to exercise and may thus be detrimental for athletes competing in both anaerobic and aerobic sports.

If you take small amounts of berberine, ALA, resveratrol, or other agents that have been shown to exert their health benefits via AMPK, though, it is very unlikely that the previously discussed unwanted side effects surface (don't expect direct ergogenic effects, though). Moderation is - as so often - the key to perfect happiness | Comment on FB!
References:
  • Barnes, Brian R., et al. "The 5′-AMP-activated protein kinase γ3 isoform has a key role in carbohydrate and lipid metabolism in glycolytic skeletal muscle." Journal of Biological Chemistry 279.37 (2004): 38441-38447.
  • Cuthbertson, Daniel J., et al. "5-Aminoimidazole-4-carboxamide 1-β-D-ribofuranoside acutely stimulates skeletal muscle 2-deoxyglucose uptake in healthy men." Diabetes 56.8 (2007): 2078-2084.
  • Hayashi, Tatsuya, et al. "Evidence for 5′ AMP-activated protein kinase mediation of the effect of muscle contraction on glucose transport." Diabetes 47.8 (1998): 1369-1373.
  • Narkar, Vihang A., et al. "AMPK and PPARδ agonists are exercise mimetics." Cell 134.3 (2008): 405-415.
  • Niederberger, Ellen, et al. "Activation of AMPK and its Impact on Exercise Capacity." Sports Medicine (2015): 1-13.
  • Olesen, Jesper, et al. "Exercise training, but not resveratrol, improves metabolic and inflammatory status in skeletal muscle of aged men." The Journal of physiology 592.8 (2014): 1873-1886.
  • Saha, Asish K., et al. "Downregulation of AMPK accompanies leucine-and glucose-induced increases in protein synthesis and insulin resistance in rat skeletal muscle." Diabetes 59.10 (2010): 2426-2434.
  • Shen, Q. W., et al. "Effect of dietary α-lipoic acid on growth, body composition, muscle pH, and AMP-activated protein kinase phosphorylation in mice." Journal of animal science 83.11 (2005): 2611-2617.
  • Zhang, Bei B., Gaochao Zhou, and Cai Li. "AMPK: an emerging drug target for diabetes and the metabolic syndrome." Cell metabolism 9.5 (2009): 407-416.

Olive Oil, a Health & Longevity Food | Plus: Frying With the Right Oils, Quickly + Discontinuously not Half as Hazardous for Your Heart, Pancreas & Waist as Previously Thought

$
0
0
If the frying time is short (2-5 min) and the heat not extreme, it's no problem to fry with virgin olive oil. If that's not the case there are better options.
You will probably remember my Facebook post about olive oil having recently become the first food that may officially call itself heart healthy in the European union. As María-Isabel Covas et al. point out in their latest paper, this leave a key question for the consumer unanswered: Which olive oil is the for you and your health? And how strong is the evidence it's actually going to make a sign. health difference (Buckland. 2015)?

In today's SuppVersity article I am going to answer these question and then turn to another, related issue: The alleged health-hazards of cooking and frying with vegetable oils as they were reviewed by Carmen Sayon-Orea (2015) and Carmen Dobarganes (2015):
Lean more about frying& co at the SuppVersity

The Quest for the Optimal Frying Oil

MUFA Modulates Gut Bacteria → Weight Loss

Taste of Olive Oil Heals - Flavor's Enough!

GMO Soybean Oil Proven to Be Pro-Inflammatory

"Pimp My Olive Oil" - W/ Extra Antioxidants

Frying Does not Just Oxidize Oils, It Does Fat More!
  • Does it have to be virgin olive oil and how significant are the health benefits? The data from the EUROLIVE longterm study (Cicero. 2005) is unquestionably one of the more convincing arguments in favor extra virgin vs. regular olive oil (VOO). In said study 200 individuals from five European countries were randomly assigned to receive 25 ml/d of three similar olive oils, but with differences in their phenolic content (from 2.7 to 366 mg/kg of olive oil). The oil was administered in intervention periods of 3 weeks preceded by 2-week washout periods and the differential effects on important health markers were compared.

    What the authors found was that all olive oils increased HDL-cholesterol and the ratio between the reduced and oxidised forms of glutathione, but only the consumption of medium- and high-phenolic content olive oil (as you would buy it as "virgin olive oil" and "extra virgin olive oil" on the market) decreased lipid oxidative damage biomarkers such as plasma oxidised LDL, un-induced conjugated dienes and hydroxy fatty acids, without changes in F2-isoprostanes.
    Figure 1: Reduction in oxidized LDL in the PREDIMED study on Traditional Mediterranean Diet (TMD) with either virgin olive oil or nuts as one of the dietary sources of fat vs. recommended low fat diet (Fito. 2014).
    As Covas et al. (2015) point out, the scientists who conducted this larg-scale trial also found that the increases in HDL-cholesterol and the decrease in the lipid oxidative damage were linearly linked to the phenolic content of the olive oil the subjects consumed" (Covas. 2015)
    Table 1: Randomised, controlled studies on the effect of VOO on inflammatory markers (Covas. 2015)
    Even if we didn't have all the "Mediterranean diet studies" and the host of studies confirming the potent anti-inflammatory effects of virgin olive oil (see Table 1), the result of this well-controlled large-scale intervention alone would be quite convincing. In conjunction with the more recent PREDIMED study (Martínez-González. 2014; Fitó. 2014), however, the argument in favor of "virginity" (for olive oils ;-) becomes even stronger. An analysis of the PREDIMED study revealed that the beneficial effects of a Mediterranean style diet on LDL oxidation are most pronounced if extra virgin olive oil (with a high phenolic content of 316 mg/kg). With the EVOO version neither the "nutty" Mediterranean diet nor the still recommend low fat diet could compete (see Figure 1).
    Figure 2: The association between olive oil consumption (quartiles (Q) and per 10 g/d) and (a) overall mortality and cause-specific mortality ((b) CVD mortality, (c) cancer mortality and (d) other causes of mortality) in the European Prospective Investigation into Cancer and Nutrition Spanish cohort study (Buckland. 2015).
    The question you may still want to ask, though, is probably: "Are these markers actually relevant for my health?" Well, I guess we can hardly tell for sure what it is that mechanistically reduces the risk that you will die before your time, but the existing epidemiological data in Figure 2 leaves little doubt that the health benefits of consuming virgin olive oil can make the difference between life and death.

    So again, which oil do you use? The "extra virgin" among the olive oils, obviously. After all, EVOO has shown to promote additional benefits to those provided by regular olive oil and the few alternative vegetable oils. Effects of which Covas et al. point out that they are mediated by EVOO induced increases in the antioxidant content of LDL, nutrigenomic effects, and the modulation of atherosclerosis-related genes towards a protective mode.
  • Does cooking and frying with vegetable oils kill? I have been addressing this issue shortly in my articles on the problems that arise with cooking with lard and tallow (read it) and my article about the "best" cooking oils (read it), but since we are already talking "oils" - in this case "olive oils" - it may be worth taking a look at two recent papers by Dobarganes et al. (2015) and Sayon-Orea et al. (2015).
    Table 2: Overview of the various substrates of vegetable oil and their effects in different experimental models as summarized by Dobarganes and Márquez-Ruiz (2015).
    In their latest review Dobarganes and Márquez-Ruiz list a whole host of processes and scientific evidence that (a) proves that there can be health hazardous compounds that form when you cook thermally unstable vegetable, that (b) these compounds are readily absorbed by mouse and man and that (c) even the relatively "small" amount that is found in industrially produced fried foods can be a threat to our health if we consume them in excell (see Table 2).

    Figure 3: Odds and hazar ratios and 95 % CI for the fully adjusted model in the studies included in Sayon-Orea's 2015 systematic review. * Fried food consumption as exposure. † Olive oil consumption as exposure. ‡ Sunflower oil consumption as exposure. § Palm oil consumption as exposure.
    This does not mean, though, that you will drop dead from the occasional serving of French fries - and that despite the existing evidence that some compounds that form during frying can impair the nutritional value of food or be potentially harmful. If you look closely at the time and heat it takes for the bad byproducts of cooking and frying to arise, it is evident that it's not you, but rather the food industry and restaurants with their high temperatures and cooking times that are to blame for the problems. They are the ones using the "discontinuous frying process" of which Dobarganes and Márquez-Ruiz say that only they allow frying oils to reach "degradation levels much higher than that established for human consumption" (Dobarganes. 2015).

    It is thus hardly surprising that Sayon-Orea et al.'s systematic review disproves the myth "that frying foods is generally associated with a higher risk of CVD" (Sayon-Orea. 2015 | my emphasis). Furthermore the authors analysis of the existing evidence indicates that cooking and frying with the previously praised virgin olive oil, in particular, is actually with a significantly reduced risk of CVD clinical events (see Figure 3).

    At this point it may be worth pointing out that this review has a small selection bias. If you look at the correlates in studies that are not as specifically interested in fried foods as the one reviewed by Sayon-Orea, but rather at food choices in CVD patients or diabetics there are positive correlations, correlations with "junk food", if you will. Therefore we can assume that any association between fried food consumption and cardiovascular disease (CVD) risk is probably mediated by the potentially obesogenic effect of certain types fried foods. Foods that are usually of overall low nutritive, but high caloric value - specifically if they are produced industrially or by fast food restaurants.

    If you are frying your foods at home, use oils with high amounts of unsaturated fast like virgin olive oil (or alternatives for longer frying durations and higher temperatures) and don't start frying snickers or ice-cream (as seen on TV ;-), frying your foods may actually be way less hazardous than many of you probably thought.
So what did you learn today? The health benefits of olive oil are not only, but largely dependent on its polyphenol content. From previous SuppVersity articles, you will know that those can be damaged by cooking and frying, but low cooking temperatures and short frying times minimize the risk of (a) missing out on all the polyphenol action in virgin olive oil and (b) allowing too many of the health hazardous metabolites of high PUFA oils - don't forget that olive oil still contains relatively high amounts of omega-6s - to rise.

The Quest for the Optimal Cooking Oil: Heat Stable, Low PUFA & Cholesterol Free - High MUFA Sunflower / Canola, Olive, Coconut & Avocado Oil Qualify for the TOP5 | more
Thus, unless you're a weak-willed victim of the food industry, your risk of dying from frying induced... ah, I mean from fried-food related heart disease is minimal. The same goes for your risk of obesity and diabetes... and let's be honest: Can you imagine a "Mediterranean Diet" (MeD) without tons (and I mean "tons") of fried foods? I can't. What I can imagine, though, is that the use of heat stable (virgin olive) oils, discontinuous frying to ensure overall short frying times, as well as frying healthy not junk food (mostly unbreaded meats and veggies) make the health-relevant difference between the effect of fried foods in the MeD and those from the Standard American Diet, which are usually fried discontinuously in less heat stable oils  | Comment
References:
  • Buckland, Genevieve and Carlos A. Gonzalez. "The role of olive oil in disease prevention: a focus on the recent epidemiological evidence from cohort studies and dietary intervention trials." British Journal of Nutrition 113 (2015): pp S94-S101. 
  • Cicero, Arrigo FG, et al. "Changes in LDL fatty acid composition as a response to olive oil treatment are inversely related to lipid oxidative damage: The EUROLIVE study." Journal of the American College of Nutrition 27.2 (2008): 314-320.
  • Covas, María-Isabel, Rafael de la Torre and Montserrat Fitó "Virgin olive oil: a key food for cardiovascular risk protection." British Journal of Nutrition 113 (2015): pp S19-S28. 
  • Dobarganes, Carmen and Gloria Márquez-Ruiz "Possible adverse effects of frying with vegetable oils." British Journal of Nutrition 113 (2015): pp S49-S57. 
  • Fitó, Montserrat, et al. "Effect of the Mediterranean diet on heart failure biomarkers: a randomized sample from the PREDIMED trial." European journal of heart failure 16.5 (2014): 543-550.
  • Martínez-González, Miguel Á., et al. "Extra-virgin olive oil consumption reduces risk of atrial fibrillation: the PREDIMED trial." Circulation (2014): CIRCULATIONAHA-113.
  • Sayon-Orea, Carmen, Silvia Carlos and Miguel A. Martínez-Gonzalez "Does cooking with vegetable oils increase the risk of chronic diseases?: a systematic review." British Journal of Nutrition 113 (2015): pp S36-S48.

Energy Balance and Everyday Activity Explain Weight Loss Success / Failure W/ Exercise in Men, But Not in Women

$
0
0
Bicycling to work is one of these "small things" that may make the difference between lean and obese.
I know this is not what your friends will want to hear, but for 99.9% of them it's not their genes which are to blame for their inability to lose weight. It's much simpler than that: It's their inability or unwillingness to induce a large enough caloric deficit to force their bodies to tap into the fat stores. Don't get me wrong: It's obvious that genes, with their direct and indirect influence on one's basal energy requirements (think of being tall vs. being small, if nothing else), amount of muscle, and even ability to handle glucose and fats, will factor in here. In the end, however, it's everyone's knowledge about the dos and don'ts of dieting, effort and dietary adherence that will make the difference.

That's no news for you? I think the results of a recent study from the University of Kansas Medical Center and the Texas Tech University will still come as a surprise. Usually, we talk about cheating on one's diet, skipping scheduled workouts and eating foods people are not supposed to eat, when we discuss the reasons why people fail. The results of said study, however, suggest that something else may have a much larger impact: Our regular non-exercise physical activity.
No "metabolic damage" here, but here are posts that relate do increased / decreased REE

Orgasm Hormone Increases REE

9 Tricks to Keep You REE Up

High EAA Intake, High REE

You're not a Bomb Calorimeter

Calorie Shifting for Max. Fat Loss

Met. Damage in Big Losers?
If you've read my March 2015 article "It Doesn't Have to be an Exhaustive Workout - Increasing Physical Activity Just as Effective as Strength, Endurance or Combined Exercise to Lose Fat and Build Muscle" (read it now), you will know about the importance of "taking the stairs", standing instead of seating, bicycling to work and other often overlooked low-intensity non-exercise physical activity in our everyday lives. Interestingly enough, it is just this type of low intensity 'non-exercise' of which the so-called "Midwest Exercise Trial 2"indicates that it is what distinguishes the weight loss responders (>5% weight loss) from the non-responders (<5% weight loss) in a relatively tightly controlled "work out five times per week for 10 months to lose weight"-intervention by Herrmann et al. (2015).

Before we are dealing with this surprising result, though, let's first take a look at what exactly the N=141 18-30 year-old men overweight/obesity (BMI 25-40 kg/m²) subjects had to do in this 'exercise for weight loss study' (details can be found in the description the scientists published when they registered their clinical trial | Donelly. 2012):
  • Table 1: It is important to note that there were no sign. baseline differences in weight, age, etc. between responders and non-responders among the study participants (Herrmann. 2015).
    the subjects exercised on 5 days of the week - one of the session was "choose the activity you want", the other sessions were performed under supervision walking/jogging on treadmill
  • the duration / intensity of all workouts was matched to initially burn 150 kcal; from months for on, 400 and 600 kcal/session (this is in line with the "2008 Physical Activity Guidelines for Americans" | USDA. 2008) 

I see you're looking for the dietary advise? Well, there was none. That may look awkward, but in view of the fact that the scientists wanted to see whether the simple adherence to the USDA "Physical Activity Guidelines for Americans" would make a difference, the subjects were told to stay on their regular (junk food?) diets.
A friendly reminder for the trainers out there: While it may be enough to increase your clients activity level, long-term weight loss can be facilitated only if you attack all weight- and health-relevant aspects of a clients life-style. That's (I) exercise and everyday activity, (II) diet and (III) sleep (circadian rhythm), stress and related aspects of their lifestyle.
As the name of the study or rather the index "2" in the name implies, the "Midwest Exercise Trial 2" is a follow up study. It's a follow up that was supposed to elucidate (a) what distinguishes responders from non-responders and whether (b) the gender differences in weight response Donelly et al. observed in their 2003 predecessor study were coincidental or something we have to keep in mind, whenever we are designing exercise-based weight loss routines for men and women..
Figure 1: Total daily energy expenditure (TDEE), nonexercise energy expenditure (NEEx), and resting metabolic rate (RMR) at baseline and 10 months in responders (RS) and nonresponders (NR) to an aerobic exercise intervention.
What should I say? If you look at the data it would almost seem as if (2) was the case: Men and women appear to respond very differently to this kind of exercise-based weight loss efforts. Yes, the data in Figure 1 shows that there is a trend for non-responders from both sexes to be less active in their free time and thus having a lower non-exercise induced energy expenditure (NEEEx). On the other hand, though, ...
  1. Figure 2: Nonexercise physical activity (NEPA) and sedentary time across 10 months in responders (RS) and nonresponders (NR) to an aerobic exercise intervention (Herrmann. 2015).
    only the male non-responders are truly characterized by their tendency to take the five weekly workouts as an excuse to use the elevator and drive the 200m to the next fast-food outlet by car, while 
  2. there is no such compensatory effect on NEEEx in the women and even an increase in resting metabolic rate (so no metabolic damage or shut-down) in the female non-responders
This trend for a "compensatory effect" on non-exercise physical activity (NEPA) in male and its absence is in female non-responders becomes even more obvious in Figure 2.
Figure 3: Rel. energy balance in male and female weight loss responders and non-responders in month 10 - data calculated as (total intake / total expenditure - 1)*100 based on data from Herrmann et al. (2015).
If we go back to my initial comment on caloric deficits and do the math that's required to calculate the relative difference between the total reported energy intake and the estimated energy expenditure, we get an excellent explanation for the fact that the male "non-responders" don't lose weight: They simply weren't in caloric deficit (see Figure 3); and that - and this is actually the most interesting finding - not because they ate more (the reported energy intake didn't change much), but because they moved less in their everyday lives!
I don't want to point with a finger to the non-responders, but energy intake underreporting is an issue you cannot ignore with overweight young(er) women (data from Smith. 1994).
So, what to we do with the women? Is there something that makes women resistant to exercise induced weight loss? I am not sure if it is politically to discuss this, but previous studies actually confirm the obvious: Women tend to lie about their food intake, more frequently than men. Particularly in overweight women underreporting (consciously or not - I don't care) is highly prevalent (Klesges. 1995; Smith. 1994). Especially the highly obesogenic snacks people and caloric beverages tend to "inhale" in-between their meals are often "forgotten" (Poppitt. 1998). Next to an overall tendency to underreport their overall energy intake, obese individuals have also been found more likely to overreport their protein intake and "forget" about fats and sugars, in particular (Heitmann. 1995), ... but let's focus on this study.

With the estimated number of calories that are "forgotten" being estimated around ~17% in all women (sign. higher in obese women), the sex difference may have a methodological, not a physical cause. The only problem here is that all women were overweight or obese. We do thus have to assume that the "responders" were underreporting their food intake, as well. So, if the female non-responders don't compensate on either the physical activity or the diet-side of things and the increasing resting energy expenditures of the non-responders (which would by the way still indicate they ate more than they said) excludes that they had a tough time due to being genetically disadvantaged by "having a slow metabolism" or "a thrifty phenotype", further research is necessary to elucidate what exactly it is that makes some women fail, where others succeed.

Luckily we don't need the answer to this question to state at least one very important conclusion: Diet interventions that are targeted towards exercise induced increases in energy expenditure are better suited for men - in particular for those men who are willing to actually increase their overall activity level, instead of compensating for the time they spend working out in the gym, on the track or wherever else by increasing their "couch time" | Comment on Facebook!
References:
  • Donnelly, Joseph E., et al. "Effects of a 16-month randomized controlled exercise trial on body weight and composition in young, overweight men and women: the Midwest Exercise Trial." Archives of Internal Medicine 163.11 (2003): 1343-1350.
  • Donnelly, Joseph E., et al. "A randomized, controlled, supervised, exercise trial in young overweight men and women: the Midwest Exercise Trial II (MET2)." Contemporary clinical trials 33.4 (2012): 804-810.
  • Herrmann, Stephen D., et al. "Energy intake, nonexercise physical activity, and weight loss in responders and nonresponders: The Midwest Exercise Trial 2." Obesity 23.8 (2015): 1539-1549.
  • Klesges, Robert C., Linda H. Eck, and JoAnne W. Ray. "Who underreports dietary intake in a dietary recall? Evidence from the Second National Health and Nutrition Examination Survey." Journal of consulting and clinical psychology 63.3 (1995): 438.
  • USDA, Physical Activity Guidelines Advisory Committee. "Physical activity guidelines for Americans." Washington, DC: US Department of Health and Human Services (2008): 15-34.
  • Poppitt, S. D., et al. "Assessment of selective under-reporting of food intake by both obese and non-obese women in a metabolic facility." International journal of obesity and related metabolic disorders: journal of the International Association for the Study of Obesity 22.4 (1998): 303-311.
  • Smith, Wayne T., Karen L. Webb, and Peter F. Heywood. "The implications of underreporting in dietary studies." Australian journal of public health 18.3 (1994): 311-314.

Yogurts, Cheeses & Beyond - A Comprehensive Review of the Potential Health Benefits of Fermented Dairy Products

$
0
0
Yogurt does not have to be served this way to be healthy, but I bet many of your friends and relatives would be amazed and much more likely to pass on the cream cake or tiramisu if the option was an appetizing dessert like that.
In a world where being vegan is "the new sexy" and eating animal products "the new smoking", dairy has lost much of its former appeal. I mean, we all remember how the literal "glass of milk" has been marketed as a daily health booster, right? Well, times have changed and that despite the fact that an impartial review of the evidence suggests more benefits than downsides to dairy consumption. Specifically fermented dairy, first and foremost yogurt, but also cheese can, and in the case of yogurt maybe even should be part of your of your diet. And that's not just because both are an often forgotten, but essential part hailed "Mediterranean diet" (Vasilopoulou. 2013). The same diet of which recent studies say that it's associated w/ a -30% reduced CVD risk (Estruch. 2013).
You can learn more about dairy at the SuppVersity

Dairy Has Branched-Chain Fatty Acids!

Is There Sth. Like a Dairy Weight Loss Miracle?

There is Good A2 and Bad A1 Dairy, True or False?

Lactulose For Your Gut & Overall Health

Milk Kills, PR Says + Perverts the Facts

Milk / Dairy & Exercise - A Perfect Match?
How's that? Well, cheese may be full of saturated fat and cholesterol. In controlled trials, however, even high fat cheese has - in contrast to butter, for example (Hjerpsted. 2011) - no or even beneficial effects on the total and LDL cholesterol levels of otherwise healthy individuals. In addition, real dairy cheese has been found to have neutral effects on body weight when it is consumed as part of an otherwise healthy diet. Some traditional types of cheese even share the anti-hypertensive effects of yogurt, which is still the real star among the fermented dairy products. A star that has been shown to prevent weight gain, reduce cholesterol and more meaningful makers of heart disease risk, to improve glycemia, and to prevent the development and/or progression of type II diabetes in both experimental and observational studies (Tholstrup. 2006; Nestel. 2008; Mozaffarian. 2011, Tapsell. 2015).
Figure 1: A study comparing the effects of getting 13% of one's total daily fat intake from cheese vs. butter on the blood lipids in healthy men and women shows increases in TC and LDL only with butter (Hjerpsted. 2013). In contrast to the total and LDL cholesterol levels, the total / HDL cholesterol ratio wasn't affected sign. by butter though. You can thus expect both forms of high fat dairy having negligible cholesterol mediated effects on the heart health of healthy indiv.
In short, the existing scientific evidence leaves little doubt that yogurt is, maybe next to whey (learn why), the star among the dairy based health foods. Part of its beneficial effects are probably mediated by its ability to improve integrity of our digestive tracts and thus to prevent the influx of pro-inflammatory, obesogenic, and pro-atherogenic endotoxins into the bloodstream. With it being available for almost 10,000 years, yogurt is thus the first and oldest "functional food" to act on the recently discovered link between "leaky gut", obesity and cardiovascular disease (Lam. 2011).
Figure 2: Proposed mechanisms by which yogurt consumption exerts beneficial health effects (Marette. 2015)
Some scientists like Marette & Picard-Deland even go so far as to argue that an early introduction of yoghurt into the diets of children is vital to establish a microbial community that supports long-term health. And while Taspell et al. are right to highlight that "[m]ore research is needed" (Tapsell. 2015). There's little doubt that "yogurt can deliver essential nutrients with high bioavailability and relatively low energy density" (ibid).
If the caloric content is controlled, the consumption of a high amount of dairy products (both fermented and non-fermented) is associated w/ sign. greater weight and fat loss - specifically unhealthy trunk fat (Zemel. 2015).
Simply adding yogurt or fermented dairy on top of an unhealthy diet is not going to cut it: People often fail to understand that "superfoods", no matter how "super" they are, can't work their weight loss or health magic if they are simply added on top of one's habitual diets. It is thus not surprising that the addition of yogurt and other fermented dairy products to the Western diet will not yield any significant health benefits if it does not replaces other, less healthier foods. If the energy intake is controlled for, as it was the case in a 2004 study by Zemel et al. higher dairy intakes are however - independent of their calcium content - associated w/ sign. greater weight & fat loss (s. left Figure)
The fact pertinent trials still show ambiguous results, when it comes to the effects of yogurt on body weight and composition (Chen. 2012) is mostly a results of the study designs which usually require subjects to simply increase their intake of dairy products, in general, or yogurt, in particular. As Taspell (2015) points out in a recent review this is a problem "if the energy content of the diet is not managed, particularly with high-fat varieties and with added ingredients such as sugar" (ibid). If it is managed, as in habitual consumers, though, high(er) yogurt intakes have been shown to be associated...
  • Prevalent Nutrient Deficiencies in the US: More Than 40% are Vitamin A, C, D & E, Calcium or Magnesium Deficient and >90% Don't Get Enough Choline, Fiber & Potassium | read more
    with higher scores for the Dietary Guidelines Adherence Index (DGAI) and higher intakes of key micronutrients, as well as significantly higher potassium and fiber intakes - two nutrients the average Westerner usually doesn't get enough of (Wang. 2013)
  • with reduced weight gain in a large US cohort study that tracked the food intake and weight development of 22 557 men and 98 320 women for four years; with R = -0.89 the correlation is similar to the one for the recommended amount of physical activity vs. being sedentary and thus nothing you should ignore as being practically irrelevant
  • with reduced inflammation as measured by C-reactive protein, IL-6 and TNF-a in the ATTICA study that involved 3042 healthy Greek adults for whom only 8 servings of dairy products, in general (full fat and low fat!), were linked with already significant reductions in inflammation; since a greater proportion of the cohort reported consumption of fermented dairy foods such as feta cheese (93%), hard yellow cheese (92%) and low-fat yogurt (50%) compared to low-fat milk (46%), we can yet safely assume that many of these anti-inflammatory benefits were actually due to fermented dairy products
  • with reduced type II diabetes risk (-12% or both yogurt and cheese) in the European Prospective Investigation into Cancer and Nutrition (EPIC)-InterAct Study (Sluijs. 2012);
    Table 1: HRs for risk of type 2 diabetes associated with the substitution of yoghurt (137 ga) for snacks and desserts: EPIC-Norfolk study (n=4,127 | O'Connor. 2014)
    with 28% reduced diabetes risk the results of the EPIC-Norfolk cohort study in the UK were even more impressive (O’Connor. 2014); as you can see in Table 1 the results of this study do yet also underline that the benefits will occur only if yogurt replaces other, less healthier ingredients of ones diet.
Other studies detected significantly lower common carotid artery intima-media thickness (CCA-IMT) in older, female Australian yogurt enthusiasts who consumed only 100g of common yogurt per day (CCA-IMTadj = -0.023 mm, P< 0·003 | Ivey. 2011). And as far as cheeses are concerned evidence from studies like Struijk et al. (2013) which found significant negative associations between cheese intake and the 2h-post prandial glucose levels, a marker that's highly predictive of one's future diabetes risk (Struijk. 2013) and a much better indicator of diabetes-related CVD risk than fasting glucose (Lithell. 2001), would suggest that the existing link between higher cheese intakes and diabetes may be mediated by the complex food matrices in which cheese appears in the Western diet: Cheeseburger, pizza, etc. In the standard Western diet, cheese is always added on top of other (usual junk) foods, which is much in contrast to the way it is consumed in the initially reference Mediterranean diet. 
Kids who drink more milk, tend to be leaner... and that despite (?) the fact that this stuff comes out of an animal and is full of bad cholesterol and fat - outrageous? Not exactly... more!
Does it have to be yogurt with patented probiotics? While some studies like Asemi et al. show benefits of one or several of the myriad of patented yogurt strains, most of the existing evidence suggests that regular yogurt which will also contain sign. amounts of "good" bacteria will have effects that are very similar to those of the expensive "functional foods". I mean, there's a reason yogurt and other fermented dairy foods have been part of the human diet ever since 10 000–5000 BC when we first domesticated milk-producing animals (cows, sheep, and goats, as well as yaks, horses, buffalo, and camels | Moreno. 2012).

For certain parts of the population (like people with high cholesterol, for example), certain starter cultures may yet have sign. advantages - which of the various currently available cultures will have the greatest health impact does yet still have to be elucidated. Next to the starter cultures, the protein content of the end product may be another important thing to keep in mind. Douglas et al. (2013), for example were able to show that Greek yogurt with 24g of protein per 250ml serving has a significantly higher satiety effect than yogurt with lower protein content.
Now this wouldn't be a SuppVersity article if it would rely exclusively on observational evidence. It is thus important to point out that Nestel's 2013 three-week crossover study comparing the effects of dairy foods categorized as low-fat (milk/yogurt), fermented (yogurt/cheese) or non-fermented (butter/cream/ice cream) confirmed that the concentrations of inflammatory markers like IL-6 were significantly lower on the fermented dairy diet than on the non-fermented dairy diet (P < 0.05).
Table 2: While everyone appears to believe that eating cheese was consistently associated with increased CVD risk, the majority of the existing studies shows no sign. association between cheese consumption and cardiovascular disease - especially when the data is adjusted for other dietary factors (summary from Elwood. 2010).
Clinical trials like Nikooyeh, et al. (2011) or Neyestani (2012) show improvements in glycemia, inflammation and adiponectin in type II diabetics and suggest that yogurt may be an ideal vehicle to increase our daily vitamin D3 intakes (by fortification).

Other researchers have been able to show that the consumption of a yogurt snack in the afternoon has potent beneficial effects on appetite control and eating initiation in healthy women (Ortinau. 2013; Douglas. 2013). Similar, yet in many cases more pronounced benefits have been observed in animal studies - studies that also indicate that yogurt exerts, next to its metabolic effects, direct inhibitory effects on colon cancer development and progression, too (de LeBlanc. 2004). All that doesn't negate the need for "[m]ore randomised controlled trials" but as Tapsell highlights in her recent review "the picture [which shows fermented dairy as a health food] is becoming clearer" (Tapsell. 2015). 
Probiotics Inhibit Ill-Health Effects of 7-Day Overfeeding in Man - Does This Make Yakult(R) the Perfect Tool in Your Bulking Toolbox or is it Just Another Marketing Gag? Find out!
So what? While it is obvious that yogurt and other fermented dairy products alone won't solve the Western diabesity crisis. It is unquestionably noteworthy that only 6% of the population in the US or Brazil, where the diabesity epidemic has really been taking off lately, consume yogurt on a daily basis.

As Fisberg et al. (2013) highlight in their review of the history of yogurt, this "represents a missed opportunity to contribute to a healthy lifestyle, as yogurt provides a good to excellent source of highly bioavailable protein and an excellent source of calcium as well as a source of probiotics that may provide a range of health benefits" (Fisberg. 2013).

One thing you must not forget, though, is that all the beneficial effects of yogurt and other fermented dairy products can take full effect only if they are integrated into an overall healthy diet. If you do it like my grandma and add one of those overpriced probiotic drinks to your otherwise pro-inflammatory breakfast, you may upset your knowledgeable grandson, but won't do much for your metabolic and overall health | Comment on Facebook!
References:
  • Asemi, Zatollah, et al. "Effects of daily consumption of probiotic yoghurt on inflammatory factors in pregnant women: a randomized controlled trial." Pakistan journal of biological sciences: PJBS 14.8 (2011): 476-482.
  • Chen, Mu, et al. "Effects of dairy intake on body weight and fat: a meta-analysis of randomized controlled trials." The American journal of clinical nutrition 96.4 (2012): 735-747.
  • de LeBlanc, Alejandra de Moreno, and Gabriela Perdigón. "Yogurt feeding inhibits promotion and progression of experimental colorectal cancer." American Journal of Case Reports 10.4 (2004): BR96-BR104.
  • Douglas, Steve M., et al. "Low, moderate, or high protein yogurt snacks on appetite control and subsequent eating in healthy women." Appetite 60 (2013): 117-122.
  • Elwood, Peter C., et al. "The consumption of milk and dairy foods and the incidence of vascular disease and diabetes: an overview of the evidence." Lipids 45.10 (2010): 925-939.
  • Estruch, Ramón, et al. "Primary prevention of cardiovascular disease with a Mediterranean diet." New England Journal of Medicine 368.14 (2013): 1279-1290.
  • Fisberg, Mauro, and Rachel Machado. "History of yogurt and current patterns of consumption." Nutrition reviews 73.suppl 1 (2015): 4-7.
  • Hjerpsted, Julie, Eva Leedo, and Tine Tholstrup. "Cheese intake in large amounts lowers LDL-cholesterol concentrations compared with butter intake of equal fat content." The American journal of clinical nutrition 94.6 (2011): 1479-1484.
  • Lam, Yan Y., et al. "Role of the gut in visceral fat inflammation and metabolic disorders." Obesity 19.11 (2011): 2113-2120.
  • Lithell, H., and B. Zethelius. "Glucose Tolerance and Cardiovascular Mortality." Arch. Intern. Med. 161 (2001): 397.
  • Marette, André, and Eliane Picard-Deland. "Yogurt consumption and impact on health: focus on children and cardiometabolic risk." The American journal of clinical nutrition 99.5 (2014): 1243S-1247S.
  • Moreno, Aznar LA, et al. "[Scientific evidence about the role of yogurt and other fermented milks in the healthy diet for the Spanish population]." Nutricion hospitalaria 28.6 (2012): 2039-2089.
  • Mozaffarian, Dariush, et al. "Changes in diet and lifestyle and long-term weight gain in women and men." New England Journal of Medicine 364.25 (2011): 2392-2404.
  • Nestel, Paul J. "Effects of dairy fats within different foods on plasma lipids." Journal of the American College of Nutrition 27.6 (2008): 735S-740S.
  • Nestel, Paul J., et al. "Effects of low-fat or full-fat fermented and non-fermented dairy foods on selected cardiovascular biomarkers in overweight adults." British Journal of Nutrition 110.12 (2013): 2242-2249.
  • Neyestani, Tirang R., et al. "Improvement of vitamin D status via daily intake of fortified yogurt drink either with or without extra calcium ameliorates systemic inflammatory biomarkers, including adipokines, in the subjects with type 2 diabetes." The Journal of Clinical Endocrinology & Metabolism 97.6 (2012): 2005-2011.
  • Nikooyeh, Bahareh, et al. "Daily consumption of vitamin D–or vitamin D+ calcium–fortified yogurt drink improved glycemic control in patients with type 2 diabetes: a randomized clinical trial." The American journal of clinical nutrition 93.4 (2011): 764-771.
  • O’Connor, Laura M., et al. "Dietary dairy product intake and incident type 2 diabetes: a prospective study using dietary data from a 7-day food diary." Diabetologia 57.5 (2014): 909-917.
  • Ortinau, Laura C., et al. "The effects of increased dietary protein yogurt snack in the afternoon on appetite control and eating initiation in healthy women." Nutr J 12.71 (2013): 10-1186.
  • Panagiotakos, Demosthenes B., et al. "Dairy products consumption is associated with decreased levels of inflammatory markers related to cardiovascular disease in apparently healthy adults: the ATTICA study." Journal of the American College of Nutrition 29.4 (2010): 357-364.
  • Sluijs, Ivonne, et al. "The amount and type of dairy product intake and incident type 2 diabetes: results from the EPIC-InterAct Study." The American journal of clinical nutrition 96.2 (2012): 382-390.
  • Struijk, E. A., et al. "Dairy product intake in relation to glucose regulation indices and risk of type 2 diabetes." Nutrition, Metabolism and Cardiovascular Diseases 23.9 (2013): 822-828.
  • Tapsell, Linda C. "Fermented dairy food and CVD risk." British Journal of Nutrition 113.S2 (2015): S131-S135. 
  • Tholstrup, Tine. "Dairy products and cardiovascular disease." Current opinion in lipidology 17.1 (2006): 1-10.
  • Vasilopoulou, Effie, Vardis Dilis, and Antonia Trichopoulou. "Nutrition claims: a potentially important tool for the endorsement of Greek Mediterranean traditional foods." Mediterranean Journal of Nutrition and Metabolism 6.2 (2013): 105-111.
  • Wang, Huifen, et al. "Yogurt consumption is associated with better diet quality and metabolic profile in American men and women." Nutrition Research 33.1 (2013): 18-26.
  • Zemel, Michael B., et al. "Calcium and dairy acceleration of weight and fat loss during energy restriction in obese adults." Obesity research 12.4 (2004): 582-590.

How Much Fat Will You Gain in the Next 6 Months? Your Response to Overfeeding, Low Protein Intakes & Fasting May Tell You If, Yet not How Much Weight You'll Gain

$
0
0
If you oxidize the CHOs from this meal, instead of storing it as glycogen, that's bad news for ability to maintain your body weight over the next 6-months & beyond 
You will know (and maybe hate) them, people who are eating whatever they want, whenever they want while still being not exactly shredded, but at least very lean. What do all these people who have an extremely easy time keeping their weight stable in common?

A recent study from the Phoenix Epidemiology and Clinical Research Branch at the National Institute of Diabetes and Digestive and Kidney Diseases (NIDDK) at the "glorious"National Institutes of Health (NIH) suggests that it may relate to the way they respond to fasting and overfeeding on high carb, low protein and eucaloric diets.
I have no idea why the scientists did not modify the protein intake during overfeeding

Are You Protein Wheysting?

5x More Than the FDA Allows!

More Protein ≠ More Satiety

Protein: Food or Supplement?

Protein Timing DOES Matter!

Less Fat, More Muscle!
It is by no means news that there is a considerable inter-individual variation in the energy cost of weight gain. Some people gain weight on a caloric surplus of only 10kcal/day, while others stash away hundreds of extra kcals without gaining a single pound of body fat (these figures have only illustrative values and are not meant to be "exact").
"In a prior cross-sectional study, the increase in energy expenditure (EE) with overfeeding and the decrease with fasting were found to be correlated in a small group of 14 male subjects (Weyer. 2011). Our group has previously shown that the EE response to overfeeding varies considerably among individuals but is consistent and reproducible within individuals. This individual contribution explains more of the observed variability in the EE changes with overfeeding than changes to the macronutrient content of the diet (Thearle. 2013). These studies seem to indicate that phenotypic differences may exist in the EE responses to fasting or overfeeding that may affect susceptibility to weight gain. As overeating or caloric restriction are necessary to alter weight, perturbations in energy balance may be needed to uncover responses that signify an energy conserving physiology versus a physiology that is better able to resist weight gain" (Schlögl. 2015).
In their latest study, Schlögl and colleagues extend their previous findings by addressing the question of whether this inter-individual variation in EE changes relates to future weight change. Or, to put it simply: They tried to answer the question

"Will your acute reaction to 24h overfeeding on different diets predict if you can maintain your weight over the next 6 months, or not?"

To answer the question, the 24-h EE during energy balance during fasting and four different overfeeding diets with 200% energy requirements was measured in a metabolic chamber in 37 subjects with normal glucose regulation while they resided in the clinical research unit of the NIH. Each of the diets was administered for exactly 24h with 3-day washouts in-between (breakfast at 07:00, entry into the calorimeter one hour later; further meals were provided inside the calorimeter at 11:00, 16:00, and 19:00 through a two-door airlock):
  • a eucaloric reference diet which was 80% of the weight maintaining diet to account for the reduced energy expenditure due to being confined to the metabolic chamber that contained 50% carbohydrates, 30% fats, and 20% proteins
  • a fasting trial (FST) in which the subjects sat in the metabolic chamber fasted
  • a low-protein diet (LPF) with 51% carbohydrate, 46% fat, 3% protein
  • a standard overfeeding diet (SOF) with 50% carbohydrate, 30% fat, 20% protein
  • a high-fat, normal-protein overfeeding diet (FNP) with 20% carbohydrate, 60% fat, 20% protein
  • high-carbohydrate, normal-protein overfeeding diet (CNP) with 75% carbohydrate, 5% fat and 20% protein
To be able to assess the long-term weight gain, all participants returned for follow-up visit to the NIH headquarter 6-months after the initial measures.
Let me highlight the most surprising result in advance: It is really surprising that those with the largest increase in energy expenditure in response to (high carb) overfeeding gained the most amount of weight. Traditionally, we have thought that all that matters was a significant increase in energy expenditure in response to overfeeding that would allow "hard gainers" to simply burn through the extra calories.On that occasion, their body weight and composition (DXA | unfortunately, the body fat level was not analyzed seperately) was measured and the change in body weight was correlated with (a) the decrease in 24-h EE during fasting and (b) the increase with the different overfeeding protocols.
Figure 1: 24h energy expression expressed relative to eucaloric reference diet (Schlögl. 2015)
The results of the scientists' correlation analysis were surprisingly unambiguous: A larger reduction in EE during fasting, a smaller EE response to low-protein overfeeding and a larger response to high-carbohydrate overfeeding all correlated with weight gain.
Figure 2: Sign. correlations between change in 24-EE during overfeeding / fasting and weight gain (Schlögl. 2015).
If you take a closer look at the correlations (r-values) and their significance in Figure 2 you will realize that all of them are statistically significant . In other words, there is a significant link between an increased risk of gaining weight in the next 6 months and
  • a higher decrease in energy expenditure during fasting (Figure 2; A | this should remind you of the thrifty phenotype theory, cf. Wells. 2011)
  • a smaller increase in energy expenditure during low protein dieting (Figure 2; B)
  • a higher increase in energy expenditure during carbohydrate overfeeding (Figure 2; C)
  • a higher higher reliance on fat during fasting (Figure 2; D)
Since the association of the fasting EE response with weight change was not independent from that of low-protein in a multivariate model, there are thus two independent propensities associated with weight gain (1) the very "effective" conservation of energy during caloric and protein deprivation, and (2) the wasteful handling of large amounts of carbohydrates - of these, at least the latter comes as a surprise, doesn't it?
Ha? That's crazy: While finding #1 is neither news nor surprising, it seems very awkward that a large reliance on carbohydrates during fasting and the presence of an increase in energy expenditure during carbohydrate overfeeding correlate with increased weight gain over the next 6 months. I have to admit: I expected the exact opposite.

The correlations observed in the study at hand do not change the previously discussed effects of overfeeding on different macronutrients | more
As Schlögl, et al. point out it is thus "not so much the response to caloric restriction, but rather the response to protein restriction, that defines a “thrifty” phenotype" (Schlögl. 2015). Schlögl et al. also offer an interesting explanation to the counter-intuitive link between increased respiratory quotients and thus increased carbohydrate oxidation and reduced fat oxidation during 24h of fasting which the authors attribute to the "naturally lean" individuals ability to store and thus subsequently more glucose in / from larger glycogen stores. This hypothesis is in line with previous studies that link an increased oxidation vs. storage (as glycogen) of carbohydrate with increased food intakes and weight gain (Pannacciulli. 2007; Zurlo. 1990).

Obviously, this observation leads us right to the one and only way to turn a "thrifty" into a "non-thrifty" (or at least less thrifty) phenotype: Exercise! Exercise increases the amount of muscle to store and the amount of glucose that can be stored on a per kg of lean muscle mass basis. So, if there's a way to turn an "easy-" into a "hard-gainer" it's by building muscle | Comment on Facebook!
References:
  • Pannacciulli, Nicola, et al. "The 24-h carbohydrate oxidation rate in a human respiratory chamber predicts ad libitum food intake." The American journal of clinical nutrition 86.3 (2007): 625-632.
  • Schlögl, Mathias, et al. "Energy expenditure responses to fasting and overfeeding identify phenotypes associated with weight change." Diabetes (2015): db150382.
  • Thearle, Marie S., et al. "Extent and determinants of thermogenic responses to 24 hours of fasting, energy balance, and five different overfeeding diets in humans." The Journal of Clinical Endocrinology & Metabolism 98.7 (2013): 2791-2799.
  • Wells, Jonathan CK. "The thrifty phenotype: An adaptation in growth or metabolism?." American Journal of Human Biology 23.1 (2011): 65-75.
  • Weyer, C., et al. "Changes in energy metabolism in response to 48 h of overfeeding and fasting in Caucasians and Pima Indians." International journal of obesity and related metabolic disorders: journal of the International Association for the Study of Obesity 25.5 (2001): 593-600.
  • Zurlo, Francesco, et al. "Low ratio of fat to carbohydrate oxidation as predictor of weight gain: study of 24-h RQ." American Journal of Physiology-Endocrinology And Metabolism 259.5 (1990): E650-E657.

From BodyPump to HIIT, From Weight Lifting to Cardio - How Much Energy & Fat Do You Burn During & After Your Workouts and How do PWO Carbs or Protein Affect This

$
0
0
BodyPump is a fast paced workout with barbells. Light(er) weights, high reps, loud music and a drill instructor... if you know one, you'll know all of these group based "resistance training" workouts.
Sunday and time for a brief review of the latest exercise-related publications. Today, I picked two studies that took a closer look at something I would never suggest you'd consider a primary measure of the quality of your training: The energy expenditure during and after your workouts.

While exercise and the exercise-induced increase in energy-expenditure is an important pillar of diet (+ exercise) induced weight loss. The dietary component is what makes you lose weight, while the exercise component is meant to (a) maximize the retention of lean muscle tissue and (b) improve your overall fitness and health. If you're just "working out to burn energy" you're destined to fail; not least because you will never be able to tell exactly how many kcals you've "left in the gym". And beware: Especially while dieting, it's usually much less than you think ;-)
Read more about exercise-related studies at the SuppVersity

Tri- or Multi-Set Training for Body Recomp.?

Alternating Squat & Blood Pressure - Productive?

Pre-Exhaustion Exhausts Your Growth Potential

Full ROM ➯ Full Gains - Form Counts!

Battle the Rope to Get Ripped & Strong

Study Indicates Cut the Volume Make the Gains!
  • People overestimate the energetic demands of "intense" exercise (Berthiaume. 2015) - In view of the fact that everyone knows the (inaccurate) rule of thumb that says that the amount of energy (in kcal) you expend when you're jogging is roughly your body weight times 10 (it's actually rather body weight times 7, unless you're running really fast, by the way), it's not surprising that Berthiaume et al.'s latest study shows that their subjects, 40 healthy men and women (age: 31.7±5.8 years, body mass index [BMI]: 24±2.6 kg/m²), significantly overestimated the amount of energy they expended during a (perceived) "intense" BodyPump(TM) workout.
    Figure 1: Young, healthy BodyPump practitioners overestimate the energetic demands of this kind of equipment based group workouts by over 36% (Berthiaume. 2015).
    Instead of the 394.1±116 kcal, the subjects thought they'd burned, the scientists measurements yielded an average energy expenditure of only 250.3±67.8 kcal during the 60 minute workout. Now, that's not really a problem if do BodyPump, because you like group workouts like these. In view of the fact that the typical clientele of programs like these tends to charge the energy they expend during workouts against the energy from extra food they'd like to eat (BIG mistake, learn why), this may be problematic.
    Figure 2: Just a reminder: The energy expenditure (kcal per kg of body weight per hour) due to body weight exercises calculated based on oxygen uptake during the exercises (traditional) or during the rest periods has been shown to be rather under- than overestimated (Vezina. 2014 | read more)
    Now, you may remember the results of Vezina's 2014 study (see Figure 2 and previous article). In said paper they used a much more precise method to arrive at the actual energy expenditure. In Berthiaume's study, a simple SenseWear armband was used. That's not the "traditional calc." in Figure 2 that proved to be so unreliable in Vezina's study, but it may still suffer from the same shortcomings when it comes to measuring anaerobic vs. aerobic energy expenditure. It would thus be prudent to be at least somewhat skeptical of the exactness of Berthiaume's results.
  • Exercise type and post-workout supplementation influence post-exercise resting energy expenditure and respiratory exchange ratio (Wingfield. 2015) - I know, I have written about EPOC, which is actually nothing else than the total post-exercise energy expenditure in relation to the respiratory exchange ratio, repeatedly. There is a reason, though, that the latest study from the University of North Carolina still made it into the SuppVersity news: It compared six exercise sessions, consisting of three exercise modalities and two acute nutritional interventions - that's extraordinary, for sure.
    • AEE - aerobic endurance exercise - 30-min on the treadmill at 45% to 55% of the heart rate reserve), high-intensity interval running 
    • HIIT - ten rounds of a 60-s treadmill run at 85% to 95% HRR with a 60-s passive rest period), and 
    • HIRT - high-intensity resistance training consisting of leg presses and bench presses, lunges, shoulder presses, biceps curls, and triceps extensions using free weights for three sets of 6RM to 8RM followed by a 20- to 30-s rest for each set of a given exercise and 2.5 min between each exercise 
    • CHO and PRO (25 g of CHO (maltodextrin) or PRO (whey isolate) mixed with 6 oz of water in an opaque bottle. 
    With its s randomized, crossover, double-blind design, the study is also pretty well-powered, even though it had only twenty female, recreationally active participants (mean ± SD; age 24.6 ± 3.9 years; height 164.4 ± 6.6 cm; weight 62.7 ± 6.6 kg).
    Figure 3: Overview of the study design (Wingfield. 2015).
    Next to the post-exercise resting energy expenditure (REE) and respiratory rate (RER), which were analyzed via indirect calorimetry at baseline, immediately post (IP), 30 minutes (30 min) post, and 60 minutes (60 min) post exercise, the scientists obtained salivary samples, as well (both didn't change sign.). The latter were used to determine estradiol-β-17 and cortisol levels before the workouts. To exclude any influence of dietary changes, the subjects were asked to eat diets similar to those they had consumed when they wrote their 3-day food logs at the beginning of the study. Practically speaking, this meant that, on average, subjects ingested 2,078.7 ± 679.9 kcal, 253.7 ± 97.6 g CHO (approximately 48.8% CHO), 84.3 ± 29.9 g PRO (approximately 16.2% PRO), and 80.9 ± 36.7 g of fat (approximately 35.0% fat) per day.
    Figure 4: Only the HIIT modality yielded sign. inter-group differences as far as the resting energy expenditure is concerned. Even those were very transient, though, and disappeared 30 min after the workout (Wingfield. 2015).
    Interestingly, a statistical significant effect for the resting energy expenditure (REE) was observed only in the HIIT, yet not in the HIRT trial (Figure 4, A). This is a result you may not have expected based on the assumption that any form of intense activity (like resistance training in this case) should have some sort of "afterburn" effect.
Cortisol is not your enemy - at least in the short run: As expected the hardest workout, the HIIT workout, produced the most significant increase in cortisol. The change was still not statistically significant, but I decided to mention it anyway, in order to take the chance and remind you of the fact that cortisol is a glucocorticoid that will not just gnaw away your muscles (it does so if it's chronically elevated), but is also involved in a host of beneficial processes including acute increases in performance and the facilitation of body fat loss (learn more).
  • What is less surprising is the relatively small, but "significant" (statistically, only!) increase in REE in response to protein vs. carbohydrate (Figure 4, B). So, protein is thermogenic even after a workout. Unfortunately, the increase in energy expenditure and the increase in fatty oxidation as signified by the reduced respiratory exchange ratio in Figure 5 B are way too small to be of any practical relevance.
    Figure 5: Effect of exercise modality and CHO vs. PRO supplement on the respiratory exchange ratio (RER); lower values indicate greater fat and lower carbohydrate oxidation (Wingfield. 2015).
    Eventually, the same can be said of the decrease in RER (=increase in fatty oxidation) in response to the HIIT and the increase in RER (=decrease in fatty acid oxidation) in response to the HIRT regimen. Both are statistically significant and look large enough to be relevant. When all is said and done, it does yet not really matter if you burn fat directly or glucose first. Whether you lose or gain body fat is after all a matter of the total energy balance over days and weeks, and not the fatty acid oxidation during and 60 minutes after your workouts.
So, what did we learn today? I guess the most important message is that even if it would make sense to charge the energy you expend at the gym against the amount of energy you consume in form of foods, you would fail miserably, because your estimation of how many kcals you've actually "left at the gym" are going to be hilariously inaccurate.

Five Good Reasons Why At Least 50% of Your 2015 'Cardio' Training Should Be High Intensity Interval Training (HIIT) | more
Against that background the results of the Wingfield study are still interesting, but of highly questionable practical value. Your decision whether you do steady state medium intensity cardio, resistance training or high intensity interval training should always be based on your training goals, not the energetic demands of the workouts. In that, fitter individuals (like yourself?) will see better results with high intensity interval training than classic cardio - assuming their training goal are increases in cardiovascular fitness. To maintain the fitness you have, steady state cardio can obviously still be an option; and weight training + optional protein supplements are the perfect choice for anyone who's interested in being and looking fit | Comment!
References:
  • Berthiaume, M. P., et al. "Energy expenditure during the group exercise course BodypumpTM in young healthy individuals." The Journal of sports medicine and physical fitness 55.6 (2015): 563.
  • Vezina, Jesse W., et al. "An Examination of the Differences Between Two Methods of Estimating Energy Expenditure in Resistance Training Activities." Journal of strength and conditioning research/National Strength & Conditioning Association (2014).
  • Wingfield, et al. "The acute effect of exercise modality and nutrition manipulations on post-exercise resting energy expenditure and respiratory exchange ratio in women: a randomized trial." Sports Med Open. (2015)
Viewing all 1497 articles
Browse latest View live