Quantcast
Channel: SuppVersity - Nutrition and Exercise Science for Everyone
Viewing all 1497 articles
Browse latest View live

Trying to Shed That Belly? Step Off the Treadmill and Grab Some Weights, Boys & Girls! 19x More Visceral, 1.5x Higher Subcutaneous Fat Loss W/ Resistance Training in Youths

$
0
0
Specifically for teenagers it may be important to work out in both aerobic and anaerobic workouts. So, this would be another reason to favor the combined over the other regimen.
You will probably have overheard the "knowledgeable" trainers at the gym tell their credulous clients, who just told them they "want to lose that belly fat", that the best thing they could do was to "stop spending that much time with weight training" and to do some more (steady state) cardio. Well, in general, there's nothing wrong about steady state cardio - in fact, many studies show that it is superior to resistance training when it comes to "merely" shedding body weight (in the obese). If "weight loss" is still everything you're aspiring, though, you are either new to the SuppVersity or another of the "headline skimmers" who happen to ask questions that are answered not just in the article, but actually in one of the red boxes... ah, I am digressing.

So, what I actually wanted to tell you is that a recent study from the Universities of Ottawa and Calgary (Alberta. 2015), clearly contradicts the average commercial gym chain trainer's recommendation and shows that belly fat loss is better achieved with diet + resistance training.
Are you looking for muscle builders for the year 2015? Find inspiration in these articles:

Tri- or Multi-Set Training for Body Recomp.?

1, 2, or 5 sets per Exercise? What's "best"?

Pre-Exhaustion Exhausts Your Growth Potential

Full ROM ➯ Full Gains - Form Counts!

Battle the Rope to Get Ripped & Strong

Study Indicates Cut the Volume Make the Gains!
The subjects of the study were youngsters, 304 (! the high number of participants is a huge plus of the study) 14-18 year-old overweight and obese teenagers (mean body fat almost 50%!), to be specific, who were randomized to four different treatments for 22 weeks:
Table 1: Training progression in the Aerobic
and Resistance group (Alberga. 2015)
  • aerobic training (Aerobic), 
  • resistance training (Resistance),
  • combined aerobic resistance training (Combined) or 
  • non-exercising control group (Control)
Adolescents,... ok, but unless they're too sarcopenic (=suffer from pronounced age-induced muscle loss) to hit the weights, your overweight clients or you, yourself, should be able to follow the same training programs the adolescents did and see similar results if you fully adhere to the following training prescriptions:
  • Resistance: The duration of each session progressed to a maximum of about 45 min. Exercises were primarily performed on weight machines, and when required with dumbbells (lateral raise, shrugs, bicep curls, front raise, preacher curl, dumbbell pullover) or by using one's own body weight as resistance (lunges, sit-ups and abdominal crunches).
    Table 2: Overview of the individual workouts in the Resistance group (Alberga. 2015).
    Participants alternated among exercises from groups A1, A2, B1 and B2 shown in Table 2. Participants were asked to rest for ~ 2 min between sets and were instructed on proper breathing techniques.
  • Aerobic: Participants randomized to the aerobic training group underwent a 22-week program (Table 1, left) wherein the exercise intensity and duration increased progressively to a maximum of 45 min per session. Exercise was performed on a cycle ergometer, elliptical or treadmill and participants were free to vary the machine(s) used. Exercise intensity was standardized using heart rate monitors (Polar Electro Oy, Kempele, Finland).
  • Combined: This group performed the full exercise programs done by both the aerobic and resistance training groups (Table 1, left + right) during each session for a total of 4 times per week for a maximum of 90 min per session.
Now for simplicity we assume that you'd actually achieve not just similar, but rather the exact same results as the virtual "average" study participant from Alberta's trial. In this case, I bet that most of you would prefer to lose -22.7 cm² subcutaneous body fat with resistance training than -16.2 cm² or -18.7 cm² with either aerobic or combined training. Specifically in view of the fact that only resistant and combined training triggered measurable reductions in visceral body fat, too.
Figure 1: Changes in subcutaneous (SAT) and visceral (VAT) body fat at different regions; L4L5 represents area between 4th and 5th Lumbar vertebrae; * indicates sign. difference to control; # sign. difference to aerobic (Alberga. 2015).
On the other hand, a closer look at the body fat data in Figure 1 also shows that aerobic training is the only form of training that will reduce the deep subcutaneous fat, significantly. Plus: When it's done in combination with resistance training the reductions in subcutaneous fat at L4L5, which represents the area between 4th and 5th Lumbar vertebrae, are still statistically significant and not significantly smaller than those the subjects in the resistance training only arm of the study achieved. 
Figure 2: Changes in Apo-B and Apo-B/A ratio in the three exercise and the control group (Alberta. 2015).
What may eventually tip the scale in favor of the combined training regimen, though, is not the body composition data, but rather the fact that only the combined training routine triggered statistically significant, heart healthy changes in Apolipoprotein B and the Apolipoprotein A/B ratio. After all, the latter has "repeatedly been shown to be a better marker than lipids, lipoproteins and lipid ratios" (Walldius. 2006) - scoring in the top tertile for the ApoB/A ratio, for example has consistently been associated with 89% increased risk of heart disease (Thompson. 2006) .
Figure 3: In their 2005 trial, Tufts scientists were able to show that dietary adherence, not macronutrient comp. or other diet-specific parameters is the main determinant of weight loss (Dansinger. 2005).
You must never forget, however, ... that (a) the beneficial of all four exercise regimen were achieved in the context of an energy deficit of albeit relatively, but consistent -250 kcal/day, that (b) the study had a 4-week lead-in during which all participants that didn't show at least 80% adherence to the dietary + exercise baseline intervention were kicked out, and that (c) subjects who did not attend an average 2.8 out of 3.0 workouts per week were not included in the analysis the data in Figures 1-2 is based.

This obviously leads back to Energy restriction and adherence - the two usual suspects. Without them, any effort to shed the hated body fat must fail. With them, however, only perseverance and consistency may keep from achieving your fat loss goals.

You don't believe that? Well, check out the data in Figure 3. Dansiger and his colleagues from the Tufts University tried to find out which diet, i.e. Ornish, Zone, Weight Watchers, or Atkins die, would cut the most body weight. What they found, though, was that it's always the diet the subjects could adhere to that worked the best. Against that background, it's no wonder that, in the study at hand, only those participants who had more than the minimal 70% adherence to their (aerobic) workout regimen actually lost significant amounts of deep subcutaneous fat tissue.. speaking of adherence, there were no significant differences in adherence between the three training regimen; only the control treatment on the couch obviously had 100% adherence ;-) | Comment on FB!
References:
  • Alberga, A. S., et al. "Effects of aerobic and resistance training on abdominal fat, apolipoproteins and high-sensitivity C-reactive protein in adolescents with obesity: the HEARTY randomized clinical trial." International journal of obesity (2005) (2015).
  • Dansinger, Michael L., et al. "Comparison of the Atkins, Ornish, Weight Watchers, and Zone diets for weight loss and heart disease risk reduction: a randomized trial." Jama 293.1 (2005): 43-53.
  • Thompson, A., and J. Danesh. "Associations between apolipoprotein B, apolipoprotein AI, the apolipoprotein B/AI ratio and coronary heart disease: a literature‐based meta‐analysis of prospective studies." Journal of internal medicine 259.5 (2006): 481-492.
  • Walldius, G., and I. Jungner. "The apoB/apoA‐I ratio: a strong, new risk factor for cardiovascular disease and a target for lipid‐lowering therapy–a review of the evidence." Journal of internal medicine 259.5 (2006): 493-519.

HMB For Endurance Athletes: 3g Regular HMB Make Elite Rowers Run Out of Breath 10% Later + Facilitate Fat Loss

$
0
0
HIIT on the rowing machine is a powerful fat loss tool even w/out HMB. It's yet also pretty intense, so I'd suggest that you don't do it everyday | learn more
You will probably remember Jacob Wilson's impressive 2014 HMB study (Wilson. 2014 | read more). A study that repopularized an old supplement that was once marketed as being "as potent as a weak steroid". Steroids, however, are not exactly the #1 doping agent for endurance athletes. While many (ab)use everything that could improve their performance, agents like erythropoietin (EPO) are obviously much more popular.

Against that background it is not totally obvious to do what Krzysztof Durkalec-Michalski and Jan Jeszka did in their latest study: To assess the effect of HMB supplementation on physical capacity, body composition and levels of biochemical markers in endurance athletes, elite rowers to be precise.
Learn more about the potential beneficial effects of HMB at the SuppVersity:

HMB For Fat Loss?

Hica & HMB in Yogurt

More on HMB Free Acid

Breakthrough HMB Science

HMB + Whey = Useless?!

HMB Hampers Fat Loss?
The study design was simple, yet effective: 16 elite male rowers, aged 20± 2 years, with a body weight of 87.3 ± 9.8 kg and a height of 187 ± 5 cm consumed 3×1 g HMB/day or an identically looking placebo for 2×12 weeks. "2×12"? Yes, the study wasn't just randomized, placebo controlled, and double-blinded, it was also a crossover study with a 10 days washout period between the first and the second 12 week period. This makes the results more reliable - in spite of the low number of subjects.
Figure 1: Overview of the design of this double-blind, randomized, controlled crossover trial (Durkalec-Michalsky. 2015)
Before and after the two 12-week phases, aerobic (maximal oxygen uptake, ventilatory threshold) and anaerobic (anaerobic power indices) capacity were determined and analyses of the body composition as well as levels the creatine kinase, lactate dehydrogenase, testosterone (T), cortisol (C) levels and the T/C ratio were conducted.
Figure 2: While it looks like there was a sign. testosterone (T) boost in the HMB group, the p-value is 0.569. Accordingly, only the fat mass changes showed sign. inter-group differences (Durkalec-Michalsky. 2015).
What the analyses of these data revealed was quite conclusive: The provision of "regular" calcium HMB at a dosage of "only" 3g/day had a highly significant "advantageous effecton the increase in aerobic capacity and the reduction of fat mass" (Durkalec-Michalsky. 2015). More specifically,...
  • Figure 3: Changes in maximal oxygen uptake and rates at ventilatory threshold after 12-week supplementation of HMB. Values are expressed as mean ± SD. Significant differences compared with placebo (independent samples t-tests) at: *- p = 0.03; †- p = 0.012, ‡- p = 0.002; #- p < 0.001. VO _ 2 max: maximal oxygen uptake; TVT: time to VT; WVT: load at VT; HRVT: HR at VT (Durkalec-Michalsky. 2015).
    the subjects' VO2 max increased (+2.7 mL/min/kg) significantly (p < 0.001) in comparison to PLA where it was even slightly reduced (−1.0 mL/min/kg), 
  • the ventilatory threshold, the threshold load, and the heart rat, which are the time-point, wattage, and heart rate at which further increases in respiration will no longer lead to increases in VO2 intake, were postponed by +1.2 min, +0.42 W, and +9bpm, respectively,
  • with -0.9 kg the subjects in the HMB group lost body fat, while the subjects in the PLA groups gained 0.8 kg (p = 0.03), and lastly
  • the refusal time to continue (a proxy of short term recovery) in the progressive test was extended (p = 0.04), maximum load (p = 0.04) and anaerobic peak power (p = 0.02) increased. 
What is interesting is that all these benefits occurred in the absence of changes in anaerobic adaptation or blood marker levels. This is cool, but it's also a problem, because as long as we don't know the mechanisms, it's hard to predict (a) who would benefit (most), (b) which supplements would act as synergists and (c) which supplements work via the same pathways so that taking them would make the use of HMB obsolete.
Breakthrough HMB Research: Additional(!) 10% Reduction in Body Fat, 5% Higher Lean Mass + 2x Higher Strength Gains After 12W of Heavy Lifting in Trained Individuals | more
So what do we make of the results? There's little doubt that Durkalec-Michalsky's latest study confirms that HMB can be useful not only for resistance trainees or sprinters, but also for athletes who are competing in sports with an endurance focus. Furthermore, it is yet another (non-sponsored) study to prove that it does not take the expensive free-acid form of HMB to see results.

What the study doesn't tell us, though, is whether the effects would remain significant if the subjects had been on the "athlete standard stack" consisting of creatine and whey protein. In view of the fact that there's no way to tell what mediated the VO2 and power improvements, it's also impossible to judge how likely it is that the co-ingestion of the aforementioned supps would marginalize the benefits.

So what? While it may be worth trying HMB, future studies with a focus on the mechanisms and the interactions with other supplements are still warranted | Comment on Facebook!
References:

  • Durkalec-Michalski, Krzysztof, and Jan Jeszka. "The efficacy of a β-hydroxy-β-methylbutyrate supplementation on physical capacity, body composition and biochemical markers in elite rowers: a randomised, double-blind, placebo-controlled crossover study." Journal of the International Society of Sports Nutrition 12.1 (2015): 1-11.
  • Wilson, Gabriel J., et al. "The effects of 12 weeks of beta-hydroxy-beta-methylbutyrate free acid supplementation on muscle mass, strength, and power in resistance-trained individuals: a randomized, double-blind, placebo-controlled study." European Journal of Applied Physiology (2014)

Is Intermittent Fasting "Diabesity Incompatible"? Increase in Glucose Excursions (+20-40%) + Impaired Insulin Response During Lunch and Dinner After Skipping Breakfast in T2DM

$
0
0
Whether having breakfast will help or hinder glucose control will also depend on its macronutrient composition and carbohydrate content. In their 2011 study Pereira et al. were able to show that a high carbohydrate, high GI breakfast will have a similarly negative impact on glucose control of adults and children as having no breakfast at all (Pereira. 2011). 
Intermittent fasting (IF), i.e. skipping breakfast and/or other meals in order to stay fasted for ~16h+ per day is no longer "all the rage", but still highly popular among people who believe in its health and weight loss benefits. And in fact, there is some research (also from a couple of Ramadan studies) that appears to confirm the notion that it is healthy and may - even without deliberate caloric restriction - facilitate weight and more importantly fat loss.

On the other hand, intermittent fasting conflicts with everything we've been (falsely?) told about the benefits of frequent meals. Benefits of which SuppVersity readers know that they are quasi-non-existent, in most healthy individuals and sometimes even counter-productive in obese and diabetic individuals, where most studies refute that eating more frequently provides significant weight loss benefits in the context of a calorically restricted diet.
Do you have to worry about fasting when your're dieting!?

Breakfast and Circadian Rhythm

Does Meal Timing Matter?

Habits Determine Effects of Fasting

Breaking the Fast & the Brain

Does the Break- Fast-Myth Break?

Breakfast? (Un?) Biased Review
Now, a recent study from the Diabetes Unit, Wolfson Medical Center of the Sackler Faculty of Medicine at the Tel Aviv University, the Lund University in Sweden and the Hebrew University of Jerusalem (Jakubowicz. 2015) suggests that extending your overnight fast by skipping breakfast may have real (not just corollary) detrimental effects on habitual breakfast eaters (learn why this is important) who are suffering from type II diabetes (with glycated hemoglobin (HbA1c) levels of 7–9% (the subjects in the study at hand were more than just pre-diabetic).

In this group of subjects, skipping breakfast increases post-prandial hyperglycemia (PPHG) after lunch and dinner. It lowers the important GLP-1 response to the meals (learn more about how GLP-1 is important in "Eat More, Burn More and Lose Fat Like on Crack with GLP-1!?") and impairs the subjects' already messed up insulin response. More specifically,
  • Three meals may be ok, but six meals are actually counterprodutive in T2DM.
    the lunch AUC0-180 for glucose, FFA, and glucagon were 36.8, 41.1 and 14.8% higher, respectively, and the AUC0-180 for insulin and  iGLP-1 17.0% and 19.0% lower, respectively, on the NoB[reakfast] day compared with the YesB[reakfast] day (P < 0.0001), 
  • the dinner AUC0-180 for glucose, FFA, and glucagon were 26.6, 29.6, and 11.5% higher, respectively, and the the AUC0-180 for insulin and iGLP-1 were 7.9% and 16.5% lower on the NoB day compared with the YesB day (P < 0.0001), on the other hand
In conjunction with the 30% delayed insulin peak after lunch and dinner on the NoB[reakfast] day that's bad news for anyone who has pre-existing problems with managing his blood glucose levels. 
Figure 1: While the increased glucose and impaired insulin and GLP1 response to lunch and dinner are bad, the skyrocketing FFA levels (+1,787.1%) could be used as fuel - by metabolically healthy individuals (data based on Jakubowicz. 2015).
The authors' conclusion that their study "shows a long-term influence [of eating / skipping] breakfast on glucose regulation that persists throughout the day" (Jakubowicz. 2015), is thus absolutely correct - at least in the short run.
Adjusted linear regression coefficients for 24h EI in T2DM patients according to EI at breakfast in % of total EI (Jarvandi. 2014).
While there are other benefits, the greatest benefit of skipping breakfast ideally is a reduced total energy consumption. If you are like the average type II diabetic of whom recent studies indicate that he will increase, not decrease, his energy intake when he skips breakfast (Jarvandi. 2014), or if you're looking at a study where the dietary prescription made it impossible to reduce the total energy intake, the overall effect of skipping breakfast on the body fat levels and metabolic health is likely going null or even negative. So, yes: Calories count - not just with intermittent fasting, by the way.
Whether the conclusion that "[b]reakfast consumption could be a successful strategy for reduction of PPHG [prostprandial hyperglycemia] in type 2 diabetes" applies to every type II diabetic is yet as questionable as the assumption that you could extrapolate the data from this acute phase study and use it to predict the long-term response in diabetics, let alone health individuals.
Figure 2: Hunger, satiety, plasma glucose and insulin in the Eaters and Skippers in the two conditions in Thomas (2015).
If we go back to Thomas' recently published study (I have discussed it in detail here), it is after all obvious that the scientists choice of subjects who consume breakfast regularly may have thwarted their results. I mean, the researchers from the University of Colorado School of Medicine and the Denver Health Medical Center have shown quite conclusively that one's breakfast habits will determine whether skipping breakfast increases insulin, hunger and blood lipids or not.
Practically speaking, the results of the previously discussed study by Thomas et al. (2015) imply that by replacing the habitual breakfast eaters in the study at hand by habitual breakfast skippers, the results could have been very different. Against that background and in view of the fact that Jakubowicz's study with its isocaloric lunch + dinner meals (700kcal) did not allow intermittent fasting to work its true, energy intake reducing magic, I would not overrate the practical significance of the study at hand.

Figure 3: In 1992 Schlundt et al. were able to show that habitual breakfast skippers and eaters will lose the most weight on a std. weight loss inter-vention if they are forced to give their beloved breakfast habits up.
This is all the more true in view of the fact that Schlundt et al. were able to show that the success of a 12-week weight loss intervention can depend on deviating from your breakfast habits. In said study obese habitual breakfast skippers and eaters lost the most weight if they had to follow an unaccustomed eating pattern (see Figure 3) - that's not necessarily in contrast to Thomas' results, though. After all, we are dealing with acute metabolic (Thomas) vs. long-term body weight (Schlundt) data and by now you should know that these are two completely different pairs of shoes.

Against that background, I'll simply repeat my previous recommendation: If you feel intermittent fasting works for you, stick to it! Be careful, though and don't tell yourself that it would make you lose weight if it does not help you to cut your energy intake - that's very unlikely | Comment on FB!
References:
  • Jakubowicz, Daniela, et al. "Fasting Until Noon Triggers Increased Postprandial Hyperglycemia and Impaired Insulin Response After Lunch and Dinner in Individuals With Type 2 Diabetes: A Randomized Clinical Trial." Diabetes Care (2015): dc150761.
  • Jarvandi, Soghra, Mario Schootman, and Susan B. Racette. "Breakfast intake among adults with type 2 diabetes: influence on daily energy intake." Public health nutrition (2014): 1-7.
  • Pereira, Mark A., et al. "Breakfast frequency and quality may affect glycemia and appetite in adults and children." The Journal of nutrition 141.1 (2011): 163-168.
  • Schlundt, David G., et al. "The role of breakfast in the treatment of obesity: a randomized clinical trial." The American journal of clinical nutrition 55.3 (1992): 645-651.
  • Thomas, E. A., Higgins, J., Bessesen, D. H., McNair, B. and Cornier, M.-A. (2015), Usual breakfast eating habits affect response to breakfast skipping in overweight women. Obesity. doi: 10.1002/oby.21049

Albuterol + Caffeine May be a Promising and Safe (?) Anti-Obesity Stack!? 13% Acute Increase Energy Expenditure in Humans, Long-Term Muscle Gains & Fat Loss in Rodents

$
0
0
You won't be able to peel off the fat in days on the "AC stack", but it's ability to help you burn 13% extra energy and ramp up protein synthesis will help.
No, Ann G. Liu and her colleagues from the Pennington Biomedical Research Center and the Louisiana State University Health Sciences Center are not totally out of their mind and after reading today's SuppVersity article you may even think that the idea of using prescription drug fat burners in children is odd, but not totally insane (considering the number of kids on Adderall & co). After all, the scientists latest study shows that albuterol with caffeine in dosages similar to those that have been previously approved for the treatment of asthma in children and adolescents, can safely increase thermogenesis in adults and will - at least in the rodent model - produce significant increases in lean body mass and reductions in fat mass without caloric restriction and on obesogenic (=fattening) baseline diets.
Some people say that caffeine is the last real "fat burner" left on the market

Remember: With Coffee More Won't Help More

Coffee - The Good, Bad & Interesting

Three Cups of Coffee Keep Insulin At Bay

Caffeine's Effect on Testosterone, Estrogen & SHBG

The Coffee³ Ad- vantage: Fat loss, Appetite & Mood

Caffeine Resis- tance - Does It Even Exist?
It is thus not totally crazy to assume that "this combination [caffeine + albuterol] may deserve further exploration for use in treating pediatric obesity" (Liu. 2015). What I am wondering about, though, is why Liu et al. think of pediatric obesity, first, when thei study shows, that different dosages of caffeine (0-200 mg) and albuterol (0-4 mg) yield highly significant increases in energy expenditure in 18-50 year-old, healthy, normal-weight study subjects (Figure 1). So why kids? Why not adults?
Figure 1: Changes in 24h energy expenditure in 18-50 year-old healthy normal weight subjects (Liu. 2014).
Be that as it may, without without long-term safety and efficacy trials in whoever is supposed to use the "CA"-stack as a weight loss drug, no doctor should prescribe 200mg caffeine and 2 mg albuterol to kids or adolescents; and that's despite the fact that the ~13% increase in 24h energy expenditure or, for this subject group, ~175kcal /day would probably help adults and kids, alike, lose body fat faster.
Clenbuterol won't make you as muscular as a Belgian Blue myostatin negativ bull, but its effect on myostatin and muscle protein synthesis may be potent enough to have significant body recompositioning effects (learn more)
Where does the muscle come from? As a SuppVersity reader you will know that clenbuterol, the long(er) acting cousin of albuterol, is a muscle-building myostatin inhibitor. What you may not know, though, is that the muscle building effects of other beta-2 agonists - including albuterol and salbutamol - are similarly well-established (Carter. 1994; Skura. 2008). In that, scientists believe that their ability to increase skeletal muscle mass is a result of both increases in muscle protein synthesis and decreases in protein degradation (Bates. 1991; Rogers. 1992). For clenbuterol, this increase in muscle anabolism is at least partly mediated by the aforementioned reduction in myostatin expression and an increase in muscle sensitivity to insulin, which has a primary role in protein synthesis (Bates. 1991).
If we simply assume that the chronic effects would be identical to those Liu et al. observed in the "rodent part" of their combined acute human + chronic rodent study, the benefits could be huge.
Figure 2: Weight development (B) and food intake (B) as well as changes in lean (C) and fat (D) mass in the long-term rodent study Liu et al. conducted to asses the effects of chronic caffeine + albuterol consumption on the body composition of rodents who were fed an obesogenic high fat + high energy diet to emulate the effects of the Western junkfood diet.
After all, the increase in energy expenditure was not compensated for by increases in energy intake, and the albuterol + caffeine mix did not just ameliorate the weight gain, it also triggered profound improvements in body composition (%body fat / lean mass) in the male Sprague-Dawley Liu kept on an obesogenic high fat diet in the 8-week rodent trial (see Figure 2), they conducted next to the previously mentioned human trial (see Figure 1), in which they observed 24h EE increase.
Bottom line: Liu et al. are right: Long-term safety data for the use of albuterol + caffeine in kids is actually available from studies in children and adolescents with asthma. They are also right, when they say that albuterol is an inexpensive generic medication that's already approved for the treatment of asthma in children age 6 years; and it's similarly hard to argue that caffeine is not only a food, but also an inexpensive approved nonprescription medication for the treatment of drowsiness in children aged 12 years or older.

Figure 3: If used prudently ephedrine can safely lower the amount of body fat even in normal-weight individuals (Carey. 2015) | learn more
Accordingly, there shouldn't be a problem with prescribing both to kids, if it wasn't for the sad story of ephedrine which turned out to be (a) too cheap, too potent and "too not patentable" not to be a thorn in the pharma lobby's side. Since it was unfortunately also (b) too tempting not to be overdosed by stupid idiots who didn't care that studies showed that taking more ephedrine and caffeine would only increase the sides, yet not the weight loss effects... well, you all know what happened when (a) and (b) came together, right? The FDA banned ephedrine; and I am pretty sure it's going to refer to the "ephedrine disaster" if someone tried to bring a prescription weight loss formula with albuterol and caffeine to the US market.

Against that background I have my doubts that the authors' suggestion will ever make it into the medical practice. In spite (or rather because?) the combination of albuterol and caffeine does in fact appear to be a promising adjunct to (not a replacement for) lifestyle interventions in both young and old. What do you think? | Comment on Facebook!
References:
  • Bates, P. C., and J. M. Pell. "Action and interaction of growth hormone and the β-agonist, clenbuterol, on growth, body composition and protein turnover in dwarf mice." British journal of nutrition 65.02 (1991): 115-129.
  • Carey, Andrew L., et al. "Chronic ephedrine administration decreases brown adipose tissue activity in a randomised controlled human trial: implications for obesity." Diabetologia (2015): 1-10.
  • Carter, William J., and Mary E. Lynch. "Comparison of the effects of salbutamol and clenbuterol on skeletal muscle mass and carcass composition in senescent rats." Metabolism 43.9 (1994): 1119-1125.
  • Liu et al. "The Effect of Caffeine and Albuterol on Body Composition and Metabolic Rat" Obesity (2015): Ahead of print.
  • Rogers, Kendra L., and Julie M. Fagan. "Effect of beta agonists on protein turnover in isolated chick skeletal and atrial muscle." Proceedings of the Society for Experimental Biology and Medicine. Society for Experimental Biology and Medicine (New York, NY). Vol. 197. No. 4. 1991.
  • Skura, C. L., et al. "Albuterol increases lean body mass in ambulatory boys with Duchenne or Becker muscular dystrophy." Neurology 70.2 (2008): 137-143.

When Timing Matters: When is the Best Time to Consume Caffeine Before a Workout? Is it 0, 5, 30, 60, 90 or 120 Min?

$
0
0
Timing matters with coffee / caffeine. But what's the optimal time?
I assume you believe that the statements in the "recommended usage" box on your pre-workout are science-based, right? Well, that's pretty naive. After all, 99% of the pre-workout formulas contain at least 3 ingredients that are just in there to be able to have more than just caffeine, creatine and beta alanine on the label. Against that background, it's only logical to question whether the recommendations on the label (usually "take 20-30 minutes before your workout") are valid or also just there , because "the others have it" ;-) And since caffeine is the main and in many case the only working stimulant in these products you don't want to use it in ways that doesn't allow caffeine to do its performance enhancing job optimally, right?

So let's see if we can put faith in recommendations that are not in line with the standard protocol in pertinent studies, in which caffeine is usually administered roughly 60 minutes before the workout.
Caffeine is the only working stimulant in many if not most pre-workouts on the market

Remember: With Coffee More Won't Help More

Coffee - The Good, Bad & Interesting

Three Cups of Coffee Keep Insulin At Bay

Caffeine's Effect on Testosterone, Estrogen & SHBG

The Coffee³ Ad- vantage: Fat loss, Appetite & Mood

Caffeine Resis- tance - Does It Even Exist?
As Graham points out in his 2001 review "[t]his protocol has been selected because caffeine is rapidly absorbed and plasma concentrations approximate a maximum level in 1 hour" (Graham. 2001). Whether this is actually optimal, though, had never been questioned when Graham wrote his review; and it is, as Graham rightly points out "remarkable how rarely the investigators have measured the circulating concentration of the drug they are studying" (Graham. 2001). This did not prevent Nehlig et al. (1994) and Palmer et al. (1995) to write in their reviews of caffeine as an ergogenic that waiting 3 hours would be "optimal" because this is when the caffeine-induced lipolysis produces the highest free fatty acid levels, of which the authors believe that it would be ideal for (endurance) athletes.

As logical as Nehlig's and Palmer's advise may be, is was, when Graham, who questions the validity of their advise, wrote his review in 2002, based only on logical assumptions, not on scientific evidence. The latter was published only one year after Graham's paper by Bell and McLellan (2002). Their study which was conducted at Defence R&D Canada-Toronto and examined the duration of caffeine’s ergogenic effect on the longest time-scale of any of the hitherto published studies(see Figure 1 for an overview of the timing) clearly suggests that Nehlig's and Palmer's reasoning can stand the test of experimental science.
Figure 1: Time line for arriving, blood sampling, delivery of Gatorade, cereal bar, meal, and measurement of oxygen consumption (VO2) during the treatment trials. ER, exercise ride to exhaustion interval; 1, 3, and 6, 1-h trial, 3-h trial and 6-h trial, respectively. aProcedure was done at this time for all trials (Bell. 2002).
In Bell's and McLellan's study, twenty-one subjects (13 caffeine users and 8 nonusers) completed six randomized exercise rides to exhaustion at 80% of maximal oxygen consumption after ingesting either a placebo or 5 mg/kg of caffeine (for the 70kg light subjects that's "only" 350mg per trial). Exercise to exhaustion was completed once per week at either 1, 3, or 6 h after placebo or drug ingestion. A simple, yet effective study design with interesting results:
  • Figure 2: Time to exhaustion at 80% maximal V ˙ O2 in caffeine users and nonusers 1, 3, and 6 h after caffeine ingestion. *Nonusers users. Caffeine placebo (Bell. 2002).
    Firstly, the ergogenic effect, which was measured only as the time it took the subjects until full exertion, differed between users and nonusers - with the ergogenic effect being greater and lasting longer in nonusers. 
  • Secondly, the ergogenic effects of caffeine lasted for 6h only in the nonusers. In the caffeine users, the effects lasted for "only" 1-3 h - an observation that is in line with the previously established increase in caffeine clearance with regular consumption.
  • Third- and lastly, the non-significant advantage of working out 3h after the consumption of caffeine in the habitual consumers is interesting. It's not statistically significant, though.
So, 1-3h before your workout depending on whether you are a caffeine abstainer (1h) or habitual consumer (3h) it is, then? No, let's not jump to conclusions. If we look at the results of Edward J. Ryans' 2011 dissertation on "Caffeine timing and cycling performance" there's another parameter that may significantly influence the "optimal" timing: The route of administration.

Not so fast, it does always make sense to consider all the evidence

In his study, Ryan tested the effects of chewing gum with 300mg of caffeine on the performance of moderate (<300mg/day) caffeine users during a standardized time trial cycling exercise. 
Figure 3: Cycle time trial performance across experimental treatments (Ryan. 2011).
As you can see in Figure 3, the caffeine chewing gum is best taken according to the previously cited recommendation on the pre-workout products. After all, the only significant performance benefit was observed in the -5 minute trial which took place roughly 20 minutes before the time trial (the subjects started chewing the gum 5 minutes before a steady-state warm-up and thus 20 minutes before the time-trial Ryan used to test the effects).

What do we make of the contradictory evidence

In his study, Ryan also cites the previously discussed study by Bell and McLellan and states that the differences between his and Bell's results are probably related to the different routes of administration. While he used chewing gums , Bell and McLellan relied on classic caffeine capsules. Now, the questions we have to answer are: Which is more like a pre-workout? Pill or gum? And, more importantly, what's the optimal timing for pill, gum and pre-workout?
Figure 4: Peak value, half-life and the time it takes for the levels to peak differ significantly for caffeine capsules and caffeinated drinks like coffee and cola (and presumably pre-workout products). The respective times for the peak to occur are similar times for coffee (42 +/- 5 min) and cola (39 6 +/-5 min) but delayed for capsule (67 +/- 7 min | Ligouri. 1997).
Since the studies we'd need to answer this question are not available, we have to make some assumptions: Firstly, it is only logical to assume that the caffeine capsules Bell and McLellan used in their study will take longer to deliver the full load of caffeine than chewing gums or coffee. If we secondly assume that pre-workout powders you'd solve in water will have similar effects as caffeine and cola we can resort to the 1997 study by Ligouri et al. which (luckily) has all the data we need in one figure (Figure 4).

As you can see in Figure 4, cola and coffee had a very similar serum caffeine profile with a peak after 39-42 minutes. When caffeine was administered in capsule form, though, the caffeine levels peaked almost 30 minutes later and thus 67 minutes after the ingestion. If we take this as a reference and assume that caffeine may exert its neurological and performance enhancing effects even faster when it is administered as a chewing gum, we can state the following recommendations.
Adding the right amount of taurine to your caffeine pills or preworkout may make the caffeine even more effective, and ameliorate its negative side effects such as being all psyched up, feeling jittery, etc. Learn more about the "right amount" and how using too much or too little won't help or even hurt, here.
When do I take my caffeine? The answer to this question depends on how you are going to take it. Specifically, ...
  • if you want to use a caffeine chewing gum, take it ca. 20 minutes before the workout,
  • if you plan to drink it either in form of coffee, a pre-workout, cola or an energy drink, use it ca. 35 minutes before your workout,
  • if you rely on capsules or pills take them ca. 60 min before you need peak performance
to achieve "optimal" results. Since your habitual caffeine consumption, the type of exercise, nicotine and alcohol consumption, your liver health, menstruation and a dozen of not fully researched genetic polymorphisms will all influence the pharmacokinetics of caffeine (Smits. 1985; George. 1986; Joeres. 1988; Cheng. 1990; Kamimori. 1999), it may yet be worth experimenting with these recommendations.

Your personal optimum timing may well 50-100% earlier, i.e. 45-90 minutes before your workouts. On the other hand, it's very unlikely that anything less than 20 minutes will yield optimal results. Well, unless maybe you use caffeine brain injections ;-) | Comment on Facebook!
References:
  • Bell, Douglas G., and Tom M. McLellan. "Exercise endurance 1, 3, and 6 h after caffeine ingestion in caffeine users and nonusers." Journal of Applied Physiology 93.4 (2002): 1227-1234.
  • Cheng, Wendy SC, et al. "Dose‐dependent pharmacokinetics of caffeine in humans: Relevance as a test of quantitative liver function." Clinical Pharmacology & Therapeutics 47.4 (1990): 516-524.
  • George, J., et al. "Influence of alcohol and caffeine consumption on caffeine elimination." Clinical and experimental pharmacology and physiology 13.10 (1986): 731-736.
  • Graham, Terry E. "Caffeine and exercise." Sports medicine 31.11 (2001): 785-807.
  • Joeres, Rolf, et al. "Influence of smoking on caffeine elimination in healthy volunteers and in patients with alcoholic liver cirrhosis." Hepatology 8.3 (1988): 575-579.
  • Kamimori, G. H., et al. "The effect of the menstrual cycle on the pharmacokinetics of caffeine in normal, healthy eumenorrheic females." European journal of clinical pharmacology 55.6 (1999): 445-449.
  • Liguori, Anthony, John R. Hughes, and Jacob A. Grass. "Absorption and subjective effects of caffeine from coffee, cola and capsules." Pharmacology Biochemistry and Behavior 58.3 (1997): 721-726.
  • Ryan, Edward J. Caffeine timing and cycling performance. Diss. Kent State University, 2011.
  • Smits, Paul, Theo Thien, and Albert van't Laar. "Circulatory effects of coffee in relation to the pharmacokinetics of caffeine." The American journal of cardiology 56.15 (1985): 958-963.

Eating More Protein Doesn't Help You Lean Out? Reanalysis of Often-Cited 36-Week Study Corrects Original Conclusion: Threshold Intakes and Changes (!) in Protein Intake Matter!

$
0
0
No, even the reanalysis doesn't say that a bit more protein, alone, will make you look like this ;-)
I've written about both observational and experimental studies that show how increased protein intakes can improve your body composition. So why mention another one?

Well, the study at hand which has been conducted by scientists from the Purdue University is interesting, because (a) it's not as extreme as Jose Antonios 2014 study in which the subjects consumed "Fivefold More Than the FDA Allows" (learn more), (b) it is not a simple short-term diet intervention where the high protein diet comes - as usual - out victorious and it is (c) actually a re-analysis of one of those studies that is often cited to "prove" that increased protein intakes, let alone the use of whey protein, wouldn't be advantageous for overweight and obese individuals trying to shed body fat.

But let's tackle one thing after the other. The original goal of the study at hand was to re-assess the data from Weinheimer's 2012 study which concluded that "whey protein supplementation [10, 20, 30, or 30 g of whey protein twice daily] does not affect exercise [2x resistance training 1x cardio per week] training-induced changes in body composition and indices of metabolic syndrome in middle-aged overweight and obese adults" (Weinheimer. 2012 | just to make sure you're not confused: While the lead authors changed Weinheimer <> Campbell, it's still the same team).
You can learn more about protein intake at the SuppVersity

Are You Protein Wheysting?

5x More Than the FDA Allows!

More Protein ≠ More Satiety
Protein: Food or Supplement?

Protein Timing DOES Matter!

Is Too Much Whey Pro-Diabetic?
Instead of dealing with absolutes and overall averages, only, Campbell et al. reanalyzed their data to elucidate the influence of total protein intake (TPro) and changes in protein inatke (CTPro) on exercise-induced changes in body composition and metabolic syndrome indexes. As the scientists point out in the introduction to their soon-to-be-published paper, they conducted this assessment from 3 perspectives for protein intake as follows (Campbell. 2015):
  1. TPro as a continuous variable with the use of a multiple linear regression model;
  2. CTPro during the intervention vs. each subject s usual protein intake (post-intervention value minus pre-intervention value) with the use of multiple linear regression; and
  3. TPro as a categorical variable, <1.0, ≥1.0 to <1.2, and ≥1.2 g per kg bodyweight, using a stratified analysis approach.
In that, Campbell et al. (2015) already expected that they would be able to correct their original findings. More specifically, they hypothesized that they'd find that a higher total protein intake, expressed as a continuous or categorical variable, would enhance the training-induced reduction of fat mass (FM) and gain of lean mass (LM), but not influence responses of MetS indexes (these were waist circumference, glucose, TGs, HDL cholesterol, and blood pressure).
Table 1: Overview of the results of the multiple linear regression analysis the beta² are quantitative indicators of the link between total protein intake (TPro) and change in protein intake (CTPro) (Campbell. 2015).
In addition, the scientists were quite convinced that they'd be able to show that the changes in body composition had been the most pronounced in those subjects with the highest increase in total protein intake over the course of the 36 week study period. And guess what!? Campbell et al. were able to confirm both hypotheses in their ahead-of-print paper:
  • In conjunction with exercise training, higher total protein intakes promoted positive changes in body composition. What the higher protein intakes did not do, however, was to promote further improvements in critical markers of metabolic syndrome in the 117 overweight and obese middle-aged adults who participated in the 2012 original 36-week intervention.
  • In addition, the changes in body composition, Weinheimer et al. observed when they conducted the study three years ago were the most pronounced in those subjects who recorded the largest changes in total protein intake via diet or supplements.
Now, this was to be expected, right? So why is it important? Well, it is important because Campbell's results falsify the assumption that protein supplements or increases in protein intake do "not affect exercise training-induced changes in body composition and indices of metabolic syndrome in middle-aged overweight and obese adults" (Weinheimer. 2012).
This is why I like the study: You rarely see the same group of scientists go back to their own dataset doing a re-analyses with that far-reaching effects on the original conclusions that were drawn three years ago. Without this kind of thorough research, we'd have even more "irrevocable scientific evidence" pointing us in the wrong direction, only because the analytical methods were not specific enough to give us an idea of the true complexity of the results.
Does this quote sound familiar? It should, it was after all the conclusion of the original study I have seen being cited several times byby various people to argue that increases in protein intake or the use of protein supplements (and specifically whey, which was used in Weinheimer's original study) would be a waste of time and money.
Figure 1. Temporal changes in the most important markers of body composition according to total protein intake of the subjects during Weinheimer's 2012 36-week intervention study (Campbell. 2015).
Now that Campbell et al. have published the re-analysis of their own data the correlation coefficients in Table 1 and the data in Figure 1 clearly show that a high and even more so a higher total protein intake can make a highly significant and practically relevant difference when it comes to the long-term effects of exercise on both lean body mass and fat mass. If we take more than just a cursory look we can also make the following statements about the effects of generally high protein intakes and significant increases in protein intake on the basis of the regression coefficients in Table 1:
  • "Will "Muscle Building Supplements" Give You Testicular Germ Cell Cancer?" - Find out why the myth about "pro-carcinogenic" protein powders is bogus here!
    For all subjects, higher total protein intakes and higher changes in protein intake were associated with significantly more favorable changes in body composition, fat mass and BMI; only the association with lean mass increases did not reach statistical significance in all subjects.
  • The latter is in contrast to increases in protein intake. In subjects who didn't just have a high baseline protein intake, but who actually ate more protein (from the diet or the whey supplement they received in the original study from 2012), the increase in protein intake was associated with increases in lean mass and decreases in fat mass. 
  • Comparable results were observed for regional (arms, legs, trunk, android, and gynoid) BM, FM, %FM, LM, and %LM changes (not shown in Table 1).
That's all great and certainly supports the physique improving benefits of high protein diets. What's a bit disappointing, though, is that similar correlations between higher or increased total protein intakes were not observed for any of the markers of metabolic syndrome (waist circumference, glucose, TGs, HDL cholesterol, and blood pressure).
"Fivefold More Than the FDA Allows: Extreme High Protein Diet (4.4g/kg | 307g/day) Benign & Non-Obesogenic. Plus: Macronutrient Prescription & Changes in Food Quality" - Read my article about the repeatedly referenced study by Antonio et al. | read it!
So, is eating high(er) protein worth it? Yes, it is. And it's actually quite important to highlight that sometimes it's the lack of detailed analyses of the data that may skew the results in ways that conceal health relevant findings. I know, for most doctors "health relevant" improvements would necessarily include the previously mentioned markers of metabolic syndrome, but one thing you must not forget is that those improvements occurred in all subjects in response to the exercise regimen. They were just not statistically significantly augmented in the subjects who consumed the most protein.

Speaking of consuming "the most" protein. If you compare the "high" protein intake in the original study by Weinheimer et al (2012) to the protein intake in the previously cited study by Antonio et al. 1.2g/kg+ is at best a moderate, but by no means a "high" protein intake.

This difference between "really high" (2.5-3.0 g/kg and more) and "RDA-definition high" (more than the RDA of 0.8g/kg) could well be a difference we must not ignore. After all, Campbell's stratified 2015 analyses of the data showed that the appetite ratings were significantly reduced only in those subjects in the higher, i.e. >1.2g/kg, tertile of protein intakes. If we also take into account what Antonio et al. (2014) observed in an allegedly different scenario with "really high" protein intakes, we may speculate that even higher protein intakes might (a) have yielded more "spectacular" changes in body composition and (b) have turned non-significant metabolic health advantages in the high protein eaters to significant ones | Comment on Facebook!
References:
  • Antonio, Jose, et al. "The effects of consuming a high protein diet (4.4 g/kg/d) on body composition in resistance-trained individuals." Journal of the International Society of Sports Nutrition 11.1 (2014): 19.
  • Campbell, et al. "Higher Total Protein Intake and Change in Total Protein Intake Affect Body Composition but Not Metabolic Syndrome Indexes in Middle-Aged Overweight and Obese Adults Who Performed Resistance and Aerobic Exercise for 36 Weeks." J. Nutr. jn213595 (2015): Ahead of print.
  • Weinheimer, Eileen M., et al. "Whey protein supplementation does not affect exercise training-induced changes in body composition and indices of metabolic syndrome in middle-aged overweight and obese adults." The Journal of nutrition 142.8 (2012): 1532-1539.

Is Adding Single Joint Movements on Top of Multi-Joint Exercises Necessary to Build Bigger & Stronger Arms?

$
0
0
If Arnold did them you should do them, too - right? Curls and triceps extensions for bigger arms.  A recent study in subjects with at least two years of resistance training experience negates that: Neither size nor strength of the arms will benefit from isolation exercises. At least in trained athletes on an ABAB regimen w/ 4 workouts per week that's the case.
Some people say: "Squats, deadlifts and the bench! That's all you need to do." Others compile a longer list, but still believe that there's no need or even no room for single joint exercises like biceps curls or triceps extensions. Are they right? I mean, there's no debating about the time-efficacy of multi-joint only workout routines, but what about the "gains"? Will you compromise your strength and size gains on the altar of time efficacy?

A recent study from the Santa Cecilia University and other universities in Brazil tried to answer this and related questions in a group of  trained subjects: Their study evaluated the differential effects on alterations in upper body muscle strength and size of resistance training protocols involving only multi-joint (MG) or both multi-joint (MJ) and single-joined (SJ) exercises in a single workout session in trained men (França. 2015).
Everybody does isolation exercises, but few periodize appropriately - big mistake!

30% More on the Big Three: Squat, DL, BP!

Block Periodization Done Right

Linear vs. Undulating Periodizationt

12% Body Fat in 12 Weeks W/ Periodizatoin

Detraining + Periodization - How to?

Tapering 101 - Learn How It's Done!
The participants were randomly assigned to one out of two groups: A combination group with both multi- and single joint exercise MJ+SJ (n = 10, 27.7 + 6.6 year) and a multi-joint only group MJ (n = 10, 29.4 + 4.6 years). To be included in the study, participants had to be currently practicing RT and have been continuously training for at least two years previous to the beginning of the study. Their programs had to involve both MJ and SJ exercises and had to be geared towards muscle hypertrophy. People with a history of anabolic steroid use were not accepted. Furthermore, all participants were instructed not change their nutritional habits or ingest ergogenic aids during the study. Minimum training attendance was set at 85% (all 20 volunteers complied).
"In order to increase ecological validity, RT [resistance training] program design and exercise choice were based on the common practices used in gyms and fitness centers by experienced trainees who desire to increase muscle strength and size. RT followed a linear periodization model with sequences of ordinary (two), shock (one) and restorative (one) microcyles as shown in Table 1" (de França. 2015).
During the ordinary microcycle, sets were performed to concentric failure - with one minute rest interval between sets. During the shock microcycle, each exercise was performed with the same load of the ordinary week, however, after failure, external assistance was given during the concentric phase to allow the performance of 2-5 additional repetitions, a method that's usually called forced repetitions (Ahtiainen. 2003).
Table 1: Periodization scheme used in the study (explanation follows | de França. 2015)
During the ordinary and shock microcycles,  the loads were reduced by ~10% from set to set to maintain the designated number of repetitions (Willardson. 2012). During the restorative microcycle, the loads were equivalent to 50% of the load used in the previous microcycle but the number of repetitions was kept at 10 and no load adjustment were necessary from set to set.
"Participants were instructed to take one second to perform the concentric and two seconds to perform the eccentric phase, whenever possible. Rest intervals were set at one minute between sets and two minutes between exercises" (de França. 2015).
Each session lasted approximately 35 and 50 minutes for MJ and MJ+SJ, respectively, and the subjects trained according to an A-B regimen that was performed twice a week for a total of four training days per week. In that, the lower limbs, low back and abdominal muscles were trained on Wednesdays and Saturdays through the same complementary training program for both groups.
Table 2: Overview of the RT programs | * denotes exercises done only in the MJ+SJ group (de França. 2015).
As show in Table 2, both groups performed the same MJ exercises, but the MJ+SJ groups also performed the exercises marked with asterisks. This means we are not comparing workouts with identical volume, but actually normal volume MJ only vs. high volume MJ + SJ workouts.
Why is it important that the scientists measured the size gains 5-7 days after the last workout? As a SuppVersity reader you should know that the exercise induced cell-swelling will mess with the results for at least 52h. If you don't remember that, read up on it in my previous article Cell Swelling Keeps Muscles "Pumped" For More Than 52h. Size Increases of Up to 16% After a Single Leg Workout!" (read it!)
To assess the results of the program, the researchers did 1-RM tests (for strength) and measured the flexed arm circumference (FAC) and arm muscle circumference (AMC) before the training program and 5-7 days after the last training session (see red box to learn why this is important).
Figure 1: Pre-/post-changes in arm circumference and biceps + triceps strength (de Franca. 2015).
The results of these measurements or, more specifically, the mean changes between pre- and post-test are shown in Figure 1. As the scientists highlight in their paper, significant differences between pre- and post-tests (p<0.05) were found for all variables analyzed. Comparison between groups, however, did not show significant differences for any variable (p>0.05).
SuppVersity Suggested: "Cut the Volume, Still Make Gains! Perfor-mance Gains in Sprinters Don't Suffer From Reduced Training Volume. Plus: Best Volume & Frequency for Size & Strength Gains?" | This study is also relevant because it confirms that volume reductions as it was the case for the MJ vs. MJ+SJ training in this study can often be positive | read it!
Yes, this does mean that within only 8 weeks the addition of single joint exercises on top of the "big moves" will not yield statistically significant increases in either strength or size gains in already trained individuals. 

Due to the design of the study we cannot exclude, though, that adding SJs would yield benefits in resistance training noobs, on a longer time-scale (unlikely, though, since there's rather a minor advantage for MJ only), or on a more complex split routine (e.g. arms on their own day), though. And still - in view of the fact that most trainees believe that they wouldn't gain an inch on their arms if they didn't train arms separately, thus wasting hours on doing all sorts of curls, the results of de França's study are unquestionably important. After all, they may sooth the minds of those who have long wanted to do a multi-joint only training, but have always been afraid that not doing all sorts of curls and triceps extensions may impair their "gains" | Comment!
References:
  • Ahtiainen, Juha P., et al. "Acute hormonal and neuromuscular responses and recovery to forced vs maximum repetitions multiple resistance exercises." International journal of sports medicine 24.6 (2003): 410-418.
  • de França, Henrique Silvestre, et al. "The Effects Of Adding Single-Joint Exercises To A Multi-Joint Exercise Resistance Training Program On Upper Body Muscle Strength And Size In Trained Men." Applied Physiology, Nutrition, and Metabolism (2015): Ahead of print.
  • Willardson, Jeffrey M., Roberto Simão, and Fabio E. Fontana. "The effect of load reductions on repetition performance for commonly performed multijoint resistance exercises." The Journal of Strength & Conditioning Research 26.11 (2012): 2939-2945.

Casein-Hydrolysate Beats Whey as Intra-Workout Protein: Faster Time-Trial Times vs. Water, Non-Sign. Performance Boosts Compared to CHO, Whey & Whey + CHO Beverage

$
0
0
Whey or casein hydrolysate - or rather no protein - what to use in your intra-workout beverage for endurance?
Last week, SuppVersity reader Oscar Qiu asked me which protein supplements I would suggest he'd buy. My answer was simple: "Get a cheap whey protein and if you want to spend extra money, add some micellar casein. Dose it at a ratio of 20:10 whey:casein post-workout (learn why) and, if you feel you're not getting enough protein on a daily basis, optionally, take them at a ratio of 10:20 whey:casein right before bed" (learn more about pre-bed casein).

Now, I am not going to revise this basic supplementation advice I gave based on the results of a recent study from the University of the Witwatersrand (Oosthuyse. 2015), but it may still be worth considering that other protein sources like whey-hydrolysate (learn more) or, as in this case, casein-hydrolysate may have certain context-specific benefits over the aforementioned "staple proteins".
You can learn more about dairy at the SuppVersity

Dairy Has Branched-Chain Fatty Acids!

Is There Sth. Like a Dairy Weight Loss Miracle?

There is Good A2 and Bad A1 Dairy, True or False?

Lactulose For Your Gut & Overall Health

Milk Boosts Glucose Uptake

Whey + Casein = Optimal PWO Nutrition
In said study, Oosthuyse et al. tried to find the "protein most suitable for ingestion during endurance exercise" (Oosthuyse . 2015). To this ends, the researchers compared the effects of co-ingesting either
  • 15 g/h whey-hydrolysate with (whey-CHO) or without carbohydrates (whey-PLA) or
  • 15 g/h casein-hydrolysate with (casein-CHO) or without carbohydrates (casein-PLA).
In conjunction with the placebo, only, and the carbohydrate, only, trials there are six trials, i.e. placebo, placebo+whey, placebo+casein, the 63g/h fructose: maltodextrin (0.8:1) that made up the CHO content of the test beverages, alone, and in conjunction with either whey or casein-hydrolysates.
Table 1 + 2: Dietary records (mean ± SD) for 2 days preceding the day of each experimental trial (left); composition of the experimental beverages consumed during the trials (right | Oosthuyse. 2015).
Practically speaking this meant that 2h after the last meal (postprandial), 8 male cyclists ingested either: carbohydrate-only, carbohydrate-whey-hydrolysate, carbohydrate-casein-hydrolysate or placebo-water in a crossover, double-blind design during 2 h of exercise at 60 %Wmax followed by a 16-km time trial.
Why would you even want to consume protein during endurance exercises? As the authors point out, the mechanisms by which protein supplementation during exercise may potentiate endurance performance are (1)providing additional oxidative, gluconeogenic and anaplerotic substrate, (2) reducing endogenous protein catabolism (Korach-Andre. 2002; Koopman. 2004), (3) reducing exercise-induced muscle damage (Saunders. 2005, 2007 & 2009), (4) improving rehydration (Seifert. 2006) and (b) possibly delaying central fatigue (Skillen. 2008). While all of these potential mechanism are backed up by isolated studies, the results are far from being unambiguous with conflicting evidence being presented in several studies and reviews (Cermak. 2009; Breen. 2010; Hobson. 2015). The study at hand does however add a new perspective to the research by evaluated whether the addition of protein to a carbohydrate energy drink will affect exercise metabolism and specifically the rate of oxidation of the co-ingested carbohydrate, as well as using different forms of protein. With whey and whey hydrolysate being the predominantly used forms of protein in previous studies, it is thus well possible that the conflicting evidence would have been less conflicting if all studies had used casein hydrolysate instead.
Data were evaluated by magnitude-based inferential statistics and revealed only non-significant effects on carbohydrate oxidation, measured from 13CO2 breath enrichment, by either of the two protein hydrolysate in isolation (data not shown),
Figure 1: What really counts are the performance improvements (left) and potential gastrointestinal side effects during (right, c), yet not so much right after the time-trial (right, b | Oosthuyse. 2015).
This changed, when the carbohydrates came into play: While the increased carbohydrate availability obviously lead to increases in glucose oxidation in all trials, these increases were substantially decreased (98% very likely decrease) when the carbohdrate drink was co-ingested with casein-hydrolysate (mean ±SD, 242 ±44; 258±47; 277 ±33g for carbohydrate-casein, carbohydrate-whey and carbohydrate-only, respectively). As it was to be expected, this decrease in carbohydrate oxidation during exercise had to be compensated by increases in fat oxidation - in this case a 93% likely increase from 83 ±27 and 73 in the whey-carbohydrate and carbohydrate-only to 92 ±14 g in the casein-hydrolysate group.

Figure 2:  Hydro whey and hydro casein have only slightly different amino acid makeups - *indicates essential amino acids (Oosthuyse. 2015).
Now, some people who are still believing in the long-overcome theory of exercise-induced fat loss may speculate that the increased fatty oxidation in the casein group would indicate that the co-ingestion of casein-hydrolysate would increase exercise-induced fat loss. You, as a SuppVersity reader know that the assumption that increased intra-workout fat oxidation would equal increased fat loss is total bogus. Accordingly, you will appreciate that the addition of casein to the intra-workout equation did have additional, practically relevant benefits: It lead to a significantly faster time trial ( − 3.6%; 90 % CI: ±3.2%) performances compared to placebo-water (95 % likely benefit).

Ok, now that you've hopefully memorized that you can safely ignore the non-existent fat-loss benefits of increased fat oxidation during exercise (assuming it is just to compensate a reduced CHO oxidation, as in this case), you must be careful not to jump to the similarly unwarranted conclusion that the time-trail times in Figure 1 would indicate that you or the (endurance) athletes you may be coaching should exchange all their "Gatorades" and other CHO-based intra-workout beverages for pure casein-hydrolysates.
Tired, exhausted, had to cut your workout short today? Is it the flu, or just too much BCAAs?
Don't flush all your Gatorade down the toilette, ... yet: For one, there are still issues with bloating and thirst during, as well as intestinal cramps after the workouts when you co-ingest protein and carbohydrates. More importantly, however, the performance increase the researchers saw with in the casein-hydrolysate trial reached statistical significance only in comparison to the water-placebo trial. The benefits were non-signifcant, even when casein was compared to carbohydrates, only. This does not negate that the study at hand suggest that you should prefer hydrolyzed casein over whey-hydrolysate as an intra-workout protein source. What the study certainly does not tell you, thouh, is that all athletes should replace their carbohydrate containing intra-workout beverages with water + casein-hydrolysate - even if the contemporary carbohydrate scare may make this non-alternative appealing.

Before making a final statement about "the optimal intra-workout protein source", it would also be necessary to know exactly what's responsible for the advantage - it could be the higer amount of glutamine in casein vs. whey, which could help curb the increase in ammonia during high intensity exercise (Bassini-Cameron. 2008) - a problem due to which consuming large amounts of BCAA supplements during exercise may actually do the opposite of what the shiny ads will tell you. It could yet also be any other difference in the amino acid make-up, the absorption kinetics or the peptide structure of whey- vs. casein-hydrolysates that explains the difference | Comment on Facebook!
References:
  • Bassini-Cameron, Adriana, et al. "Glutamine protects against increases in blood ammonia in football players in an exercise intensity-dependent way." British journal of sports medicine 42.4 (2008): 260-266.
  • Breen, Leigh, Kevin D. Tipton, and Asker E. Jeukendrup. "No effect of carbohydrate-protein on cycling performance and indices of recovery." Med Sci Sports Exerc 42.6 (2010): 1140-1148.
  • Cermak, Naomi M., et al. "Muscle metabolism during exercise with carbohydrate or protein-carbohydrate ingestion." Medicine and science in sports and exercise 41.12 (2009): 2158-2164.
  • Hobson, Ruth, and Lewis James. "The addition of whey protein to a carbohydrate–electrolyte drink does not influence post-exercise rehydration." Journal of sports sciences 33.1 (2015): 77-84.
  • Koopman, René, et al. "Combined ingestion of protein and carbohydrate improves protein balance during ultra-endurance exercise." American Journal of Physiology-Endocrinology and Metabolism 287.4 (2004): E712-E720.
  • Korach-Andre, Marion, et al. "Differential metabolic fate of the carbon skeleton and amino-N of [13C] alanine and [15N] alanine ingested during prolonged exercise." Journal of Applied Physiology 93.2 (2002): 499-504.
  • Oosthuyse, T., M. Carstens, and A. M. Millen. "Whey or Casein Hydrolysate with Carbohydrate for Metabolism and Performance in Cycling." International journal of sports medicine (2015).
  • Saunders, Michael J., Mark D. Kane, and M. Kent Todd. "Effects of a carbohydrate-protein beverage on cycling endurance and muscle damage." MEDICINE AND SCIENCE IN SPORTS AND EXERCISE. 36.7 (2004): 1233-1238.
  • Saunders, Michael J., Nicholas D. Luden, and Jeffrey E. Herrick. "Consumption of an oral carbohydrate-protein gel improves cycling endurance and prevents postexercise muscle damage." The Journal of Strength & Conditioning Research 21.3 (2007): 678-684.
  • Saunders, Michael J., et al. "Carbohydrate and protein hydrolysate coingestion's improvement of late-exercise time-trial performance." International journal of sport nutrition 19.2 (2009): 136.
  • Seifert, John, Joseph Harmon, and Patty DeClercq. "Protein added to a sports drink improves fluid retention." International journal of sport nutrition and exercise metabolism 16.4 (2006): 420.
  • Skillen, Rebecca A., et al. "Effects of an amino acid-carbohydrate drink on exercise performance after consecutive-day exercise bouts." International journal of sport nutrition 18.5 (2008): 473.

Using Ice / Cold Water Immersion After Workouts Will Impair Muscle and Strength Gains, as well as Vascular Adaptations

$
0
0
4x fail - if you look at the latest cold-water immersion science.
There are proven acute regenerative benefits of both cold water immersion and cold / ice application after exercise... cool? Not so cool, no. Two recent studies demonstrate: In the long run both will impair your gains.

The studies from Japan (Yamane. 2015) and Norway + Australia (Roberts. 2015) were conducted independently and published almost simultaneously in the International Journal of Sports Medicine and the Journal of Physiology, respectively. Therefore, I'd like to discuss them one after the other, before I finally tie the knots between the studies in a conclusion some of you are not going to like.
Learn more about hormesis and how antioxidants can also impair your gains

Is Vitamin E Good for the Sedentary Slob, Only?

NAC Impairs Anabolic Effects of Exercise

If Vitamin C is Low, Taking More is Good

C+E Useless or Detrimental for Healthy People

Vitamin C and Glucose Management?

Antiox. & Health Benefits Don't Correlate
"Does Regular Post-exercise Cold Application Attenuate Trained Muscle Adaptation?" that's not only the title, but also the central question in a recent study by Yamane et al. (2015). In the corresponding experiment, 14 male subjects did 5 sets of 8 wrist-flexion exercises at workloads of 70–80% of the single repetition maximum, 3 times a week for 6 weeks. Of the total of 14 male subjects,
  • 7 subjects immersed their experimental forearms in cold water (10± 1°C) for 20min after wrist-flexion exercises (cooled group), while
  • the other 7 who served as control subjects (noncooled group) refrained from putting their forearms into the 10°C cold water
At the end of the 6-week training period, the wrist-flexor thickness, brachial-artery diameter, maximal muscle strength, and local muscle endurance were measured in upper extremities.
Figure 1: Rel. changes (%) of forearm diameter (muscle size), muscle strength (of the wrist flexors), brachial-artery diameter (vascular adapation) and local muscle endurance (Yamane. 2015).
The results in Figure 1 may come as a nasty surprise to some of you: The wrist-flexor thicknesses of the experimental arms increased after training in both groups, but the extent of each increase was significantly less in the cooled group compared with the non-cooled group.

That this is not a question of post-exercising swelling, only, can be inferred from the fact that the maximal muscle strength and brachial-artery diameter did not increase in the cooled group, either. That's much in contrast to the non-cooled group where both variables as well as the local muscle endurance increased significantly. If we assume that similar effects occur for other muscle parts, it would thus not be a good idea to join Peer Mertesacker in the ice-tub that made him world-famous after the quarter-finals of the soccer world cup, last year.
The satellite cell activity of which SV readers know that it is drive - at least partly - by the inflammatory response to exercise is blunted in the cold water immersion (CWI) vs. active recovery (ACT) trial (Roberts. 2015).
What's the reason the treatments have different acute vs. long-term effects? As usual, the answer to this question is hormesis. Luckily, Roberts et al. did what it takes to provide insights into the possible mechanism in second study in which they investigated the acute effects of active recovery and cooling on a handful of parameters that are highly relevant for the chronic adaptations to resistance training  (see study 2, below) . Among those were the satellite cell activity and the phosphorylation of the protein synthesis motor p70S6-kinase, both of which were significantly more pronounced in the active recovery vs. cold immersion trial. The IL-6 and VEGF response which was measured in the Yamane study, on the other hand, did not differ significantly. In view of the fact that cooling attenuated the acute changes in satellite cell numbers and activity of kinases that regulate muscle hypertrophy, it is still likely that what we are dealing with, here, is another instance of a blunted hormetic response to exercise-induced stress.
Now, with just one study investigating only one muscle group, you may well argue that this could be an outlier and eventually it's thus not a problem or even beneficial if you use cold water application or cold water immersion after every workout.

If we add the results Llion A. Roberts et al. present in their accepted article in the The Journal of Physiology, however, it does no longer look like any of the findings were coincidental. After all, Roberts et al. conducted not one but two studies to investigate whether and why "regular cold water immersion influences muscle adaptations to strength" (Roberts. 2015). More specifically, the two experiments the researchers from Norway and Australia conducted were...
  • Table 1: Overview of the RT-program in study 1 (Robert. 2015)
    study 1 - 21 physically active men strength trained for 12 weeks (2 d/wk), with either 10 min of CWI or active recovery (ACT) after each training session. The sessions involved mainly the lower body. Training sessions were performed twice a week, separated by 72 h. The loads were set to 8-rep, 10-rep and 12-repetition maximum (RM), and weights corresponding to a proportion of each participant’s body mass.

    Strength training was progressive, and included 45° leg press, knee extension, knee flexion, walking lunges and plyometrics exercises. The plyometric component comprised countermovement drop jumps, slow eccentric squat jumps, split lunge jumps and countermovement box jumps. All strength training was supervised and was performed at normal room temperature (23–25°C). 
  • study 2 - 9 active men performed a bout of single-leg strength exercises on separate days, followed by CWI or ACT to elucidate the acute effects and potential mechanisms that explain the reduced gains in the chronic training study
The cold water immersion (CWI) itself was performed within 5 min after each training session. The procedure is described as follows: "Participants in the cold water immersion group sat in an inflatable bath (iCool iBody, iCool, Miami, Australia) for 10 min with both legs immersed in water up to the waist. Water was circulated continuously and maintained at 10.1 ± 0.3°C using a circulatory cooling unit (iCool LITE, iCool)" (Roberts. 2015). In contrast, the active recovery group performed 10 min active recovery at a self-selected low intensity on a stationary cycle ergometer (Wattbike, Nottingham, United Kingdom) at a really light mean intensity level of 59.5 ± 9.4 W.
Figure 2: Training-induced changes in type II fiber count and size (left, top), myonucle per fiber (left, bottom), leg press strength (A), knee extension strength (B), isometric torque (C) and RFD impulse (D | Roberts. 2015).
Just as it was the case in the much smaller wrist muscles in the Yamane study, the strength and muscle mass increases in the legs of the subjects in the Roberts study were blunted by the application of cold water (CWI). Practically speaking this means that the isokinetic work (19%), type II muscle fibre cross-sectional area (17%) and the number of myonuclei per fibre (26%) increased in the ACT group (all P<0.05) but not the CWI group.

If you want to know something about the reasons of these statistically significant and practically highly relevant difference are concerned, I suggest you take a closer look at the red box - it may also help you to fully understand the bottom line.
Bad News For Vitamin Fans - C + E Supplementation Blunts Increases in Total Lean Body and Leg Mass in Elderly Men After 12 Weeks of Std. Intense Strength Training | more
Bottom line: In conjunction, the studies presented in today's installment of "Too Much of a Good Thing" appear to confirm that regular post-exercise cold application to muscles might attenuate muscular and - even more surprisingly - the vascular adaptations to resistance training.

That this is neither muscle- nor subject-specific can be concluded based on the similarities of the results from the two studies cited above. Against that background, there is little doubt that Roberts et al. rightly conclude that "[i]ndividuals who use strength training to improve athletic performance, recover from injury or maintain their health should therefore reconsider whether to use cold water immersion as an adjuvant to their training" (Roberts. 2015) | Let me know what you think on Facebook!
References:
  • Roberts, et al. "Post-exercise cold water immersion attenuates acute anabolic signalling and long-term adaptations in muscle to strength training." The Journal of Physiology (2015): Accepted article.
  • Yamane, M., N. Ohnishi, and T. Matsumoto. "Does Regular Post-exercise Cold Application Attenuate Trained Muscle Adaptation?." International journal of sports medicine (2015).

Banana Starch, a Natural Resistant Starch That May Help Obese + Lean Alike Get & Stay Lean & Insulin Sensitive

$
0
0
Ripe or as in this case overripe bananas have little to no starch, green ones almost only starch and only little sucrose / fructose.
It is well-known that people with higher intakes of resistant starches have a reduced risk of becoming obese, developing diabetes and hyperlipidemia. Studies also indicate that starchy carb lovers have overall lower insulin concentrations and an increased insulin sensitivity compared to the average junk-food eater (McKeown. 2002; Liese. 2004), whose low dietary fiber consumption is linked to a reduced in insulin sensitivity and inflammation (Parillo. 2004).

What distinguishes whole grains and co from plain sugar, cornflakes and white bread is that they contain dietary fiber in its non-digestible form that is fermented in the colon, where the production short chain fatty acids (SCFA | learn more) triggers many of the well-established health benefits by direct and indirect effects on the gut-endocrine axis (Topping. 2001).
You can learn more about gut <> health interactions at the SuppVersity

Bugs Dictate What You Crave

Sweeteners & Your Gut

Foods, Not Ma- cros for the Gut

Lactulose For Gut & Health

Probiotics Don't Cut Body Fat

The Macrobiotic MaPi2.0 Diet
One of the best dietary sources of resistant starches are bananas... well, green bananas or rather the high resistant starch flour that's produced from green bananas. Although, it takes some processing to extract it from the bananas, it's classified as "RS2", i.e. naturally occuring resistant starch, because it is after all a native (vs. man-made) starch granule that is naturally highly resistant to digestion by α-amylase enzymes in the small intestine (Englyst. 1992).
Figure 1: Proximate compositions of the edible portion of bananas at different stages as classified by the color of banana peel (Lii. 1982) - only a small fraction of the original starch is already RS2, it takes processing to isolate the "natural" resistant starch from the bananas and the amount of RS2 in banana flour is variable 50%-84% (Lehmann. 2002).
Since it's a natural product, banana starches from different sources may have diverse structures and may thus also have a different degree of resistance to enzymatic hydrolysis. It is thus no wonder that previous studies by researchers from the Universidad Juá rez Autónoma de Tabasco has shown a large variety in terms of the amylose-content and resistance to digestibility among Banana starches from different sources. In general, though, all of them share the important property of being largely indigestible and being able to trigger a reduction in the glycemic and insulinic response compared to regular starches in both healthy and diabetic subjects (Ble-Castillo. 2010).
Figure 2: Effects of either 24 g of NBS dissolved in 240 mL of water per day or 24 g/day of soy milk dissolved in the same volume of water for 4 week (data represents within subj. comparisons | Ble-Castillo. 2010).
In fact, Ble-Castillo et al. were already able to show that within only 4 weeks on 24g/day of native banana starch (NBS) both the body weight and insulin sensitivity of obese type 2 diabetics significantly improved - and that not "on average", but on a "within-subject" basis as it can only be observed in cross-over study.
Why is it important to test not just in obese subjects? This is a good question and one that actually touches on (one of) the root cause(s) of the obesity pandemic. For decades, obese individuals have been told to eat like lean people. People of whom scientists observed that they stayed lean and healthy on low(er)-fat, high(er) carbohydrate diets. The consequences were - at least in some cases - literally "fatal." Over the past decade, though, we've seen lean, athletic people make the opposite mistake when they assumed that the same low-to-no-carbohydrate diet and supplements like lipoic acid that help the obese lean out would help them stay lean or become even leaner (learn more). The assumption that diets, supplements and - as in this case - certain dietary nutrients necessarily do the same thing in obese and lean individuals, however, is unwarranted and in many cases simply wrong.
In a more recent study, Guadalupe Jiménez-Domínguez repeated the Ble-Castillo study in a different, more diverse group of subjects:
Forty five subjects were screened for obese and lean participants. Anthropometric indexes and basic laboratory examinations were carried out. Participants for the obese group were included if they were healthy persons between 18 and 45 years of age, were obese, and had maintained stable weight during the three months prior to experimentation. Subjects in the normal-weight groups (lean group) were included if they were between 18 and 45 years of age, had 18.5–24.9 BMI values, had [normal fasting glycemia and]HbA1c values [...] and had maintained stable weight during the three months prior to experimentation. Subjects not included in this study were those with a previous diagnosis of diabetes, with fasting glycemia >126 mg/dL (> 7.0 mmol/L) or glycated hemoglobin > 6.5%, with digestive disorders, chronic diseases such as renal or hepatic, being pregnant, under psychiatric treatment, receiving medical or naturist treatment to reduce BW, practicing intense physical activity (> 90 min/week), receiving immuno-suppressants, or with a history of cigarette smoking or alcoholism. Thirty two participants were eligible for the study, 15 for the obese group and 17 for the lean group. However, only 10 subjects in each group completed the whole protocol" (Jiménez-Domínguez . 2015).
In said study, the subjects received a higher dose of 38.2 g of native banana starch (NBS) or the same amount of corn starch twice daily yet for only four days, before, on day 5, a 3-h meal tolerance test (MTT) was performed to evaluate the acute effects glucose and insulin responses that may explain the benefits Ble-Castillo et al. had observed (see Figure 2).
"All of the subjects received low-fiber diets at breakfast and lunch from the Nutrition Department’s restaurant during days 1‒4 of the treatment period. The low-fiber diet consisted of avoiding whole-grain/wholemeal breads and cereals, legumes, nuts, and seeds, and of removing the skins from fruit and vegetables" (Jiménez-Domínguez. 2015).
All subjects had to stick to the same baseline diet. Adherence to the diet and the randomly assigned supplements,
  • the NBS beverage, which contained 38.39 g of NBS, 31.82 g of soy milk, and 240 mL of purified water, and 
  • the DCS beverage, which contained 38.39 g of DCS, 31.82 g of soy milk, and 240 mL of purified water,
both of which had to be consumed in the fasting state (7:00 A.M.–9:00 A.M.) and before lunch (1:00 P.M.–3:00 P.M.), by counting the unopened sachets, a query regarding the missed servings and daily food records all subjects had to fill everyday before they went to bed.  
Figure 3: The 4 days on natural banana starch had quite significant beneficial effects on the glucose and insulin response to a standardized test-meal. It is yet also obvious that the obese saw greater benefits (Jiménez-Domínguez. 2015).
The most significant results in Figure 3 are not really surprising, though. As you may have expected, the native banana starch has a significant advantage over the corn starch, when it comes to its acute and chronic effects on glycemia in both, lean and obese individuals. An advantage that may well explain the significantly different metabolic effects in the Ble-Castillo study.
Figure 4: What is almost more important than the improvements in the 3h-glucose test that yielded beneficial results (see Figure 2) is that the continuous glucose monitoring over 48h depicted in this figure shows sign improvements in glycemia, as well Jiménez-Domínguez. 2015).
Bottom line: The fact that the acute provision of natural banana starch does improve the acute postprandial glucose and insulin responses in obese and lean individuals is yet only part of the good news. What's probably of greater physiological relevance is the fact that it also improved the insulin and glucose levels over the whole 48 h period that was assessed during the study.
Against that background it is not too disappointing that the resistant starch did not ameliorate the glucose responses to the test meal. A fact, that should still remind you that you have to watch what you eat - even if you make natural banana starch a regular constituent to your diet. The glucose excursions in response to high glycemic index foods / loads, of which scientists have long been speculating that they may propel the development type II diabetes, are after all at best ameliorated, yet not abolished by an increased intake of resistant starch.

Things may look very different, though if you completely replace "regular" starches with resistant starches. One of the easiest ways to do this may be by buying newly developed "functional" foods like spaghetti that contain 15% or more of their starch content in form of resistant starches from bananas and are still highly palatable (Hernández-Nava. 2009). Alternatively, you may want to check out the various recipes for resistant starches based cookies and other baked goods you can easily find on the Internet if if you google keyworkds like "banan bread", "banana cake", and "banana whatever"; and even though you won't find scientific evidence for the health benefits of each of the recipes, there is evidence for the health benefits of replacing regular starch in common recipes with resistant starches form a handful of proof of concept studies like Aparicio-Saguilan, et al. (2007)  | Comment or post your recipes on Facebook!
References:
  • Ble-Castillo, Jorge L., et al. "Effects of native banana starch supplementation on body weight and insulin sensitivity in obese type 2 diabetics." International journal of environmental research and public health 7.5 (2010): 1953-1962.
  • Englyst, Hans N., S. M. Kingman, and J. H. Cummings. "Classification and measurement of nutritionally important starch fractions." European journal of clinical nutrition 46 (1992): S33-50.
  • González-Soto, R. A., et al. "The influence of time and storage temperature on resistant starch formation from autoclaved debranched banana starch." Food research international 40.2 (2007): 304-310.
  • Hernández-Nava, R. G., et al. "Development and characterization of spaghetti with high resistant starch content supplemented with banana starch." Food Science and Technology International 15.1 (2009): 73-78.
  • Jiménez-Domínguez, Guadalupe, et al. "Effects of Acute Ingestion of Native Banana Starch on Glycemic Response Evaluated by Continuous Glucose Monitoring in Obese and Lean Subjects." International journal of environmental research and public health 12.7 (2015): 7491-7505.
  • Lehmann, Undine, Gisela Jacobasch, and Detlef Schmiedl. "Characterization of resistant starch type III from banana (Musa acuminata)." Journal of agricultural and food chemistry 50.18 (2002): 5236-5240.
  • Lii, Cheng‐Yi, Shuh‐Ming Chang, And Ya‐Lan Young. "Investigation Of The Physical And Chemical Properties Of Banana Starches." Journal Of Food Science 47.5 (1982): 1493-1497.
  • Liese, Angela D., et al. "Whole-grain intake and insulin sensitivity: the Insulin Resistance Atherosclerosis Study." The American journal of clinical nutrition 78.5 (2003): 965-971.
  • McKeown, Nicola M., et al. "Whole-grain intake is favorably associated with metabolic risk factors for type 2 diabetes and cardiovascular disease in the Framingham Offspring Study." The American journal of clinical nutrition 76.2 (2002): 390-398.
  • Parillo, M., and G. Riccardi. "Diet composition and the risk of type 2 diabetes: epidemiological and clinical evidence." British Journal of Nutrition 92.01 (2004): 7-19.
  • Topping, David L., and Peter M. Clifton. "Short-chain fatty acids and human colonic function: roles of resistant starch and nonstarch polysaccharides." Physiological reviews 81.3 (2001): 1031-1064.

Coffee - Different Roasts, Different Health Effects | Darker Roasts Better for Weight Loss, Lighter Roasts Healthier!?

$
0
0
Dark, medium or light roast - this is more than just a question of taste! The significant effect of roasting on the phenol-composition of coffee and the consequent health effects are rarely discussed.
You may remember my often misinterpreted article about bullet-proof coffee in which I actually defended the fad by providing evidence that the negative effects on blood lipids may actually be cause by not filtering the coffee vs. putting butter into it (read it). Well, today I would like to dig a bit deeper into the differential effects not of coffee brewing, but rather of coffee roasting on the of your favorite beverage's major active ingredients and its subsequent effects on your health.

Now, to get the bad news out of the way, the study from the West-German Centre of Diabetes and Health in Düsseldorf which evaluated these effects unfortunately did so in 118 overweight subjects.
You can learn more about coffee at the SuppVersity

Remember: With Coffee More Won't Help More

Coffee - The Good, Bad & Interesting

Three Cups of Coffee Keep Insulin At Bay

Caffeine's Effect on Testosterone, Estrogen & SHBG

The Coffee³ Ad- vantage: Fat loss, Appetite & Mood

Caffeine Resis- tance - Does It Even Exist?
The good news, however, is that the subjects who were recruited by articles in local media in the region of Düsseldorf, Germany, were mostly overweight, not obese (BMIs of ≥27 kg/m²) came from various age-groups (18–69 years old) and - this is important - were regular coffee consumers (at least 3 cups/day), just like you (?). With them being weight stable and free of any acute of chronic diseases (with the exception of type 2 diabetes mellitus), they are thus not the ideal study group, but decent subjects - even though we will have to be careful when it comes to making conclusions with regard to the health effects of differently roasted coffee for leaner and healthier people.

In the introduction I already alluded to the purpose of this study. What I still have to do, though, is to tell you exactly what the scientists wanted to know and how they tried to find the answer to their question(s). From previous studies, Kempf et al. knew that dark roast coffee, which is rich in the trigenolline byproduct N-methylpyridinium (NMP: 785 mmol/L) and low in chlorogenic acid metabolites has significantly more pronounced weight loss effects in pre-obese (but not normal-weight) subjects; see Figure 1) than light roast coffee when it is administered at doses of 500ml/day in a 2x4-week cross over study (Kotyczka. 2011).
Figure 1: Only the pre-obese subjects lost significant amounts of weight. A trend for higher greater weight loss in the dark roast phase of the cross-over study is however evident in all subjects (Kotcyzka. 2011).
Now, 4 weeks is not an acute study, but it's not exactly long enough to observe things like ceiling effects or the well-known "too much of a good thing" effect that may occur when agents with proven short-term benefits are administered over long(er) time periods.
A previously discussed problem with coffee is the formation of mold toxins, in particular ochratoxin A, when it's stored inappropiately. Luckily, roasting does - irrespective of whether you roast dark or light - sing. reduce the toxic mold (Van der Stegen. 2011).
What does the observational / epidemiological evidence say? Well, you know the problems with this type of data. Not only is it unreliable, it's also often not differentiated enough. It's thus impossible to tell whether the proven beneficial long-term effects of coffee consumption on type II diabetes risk (Greenberg. 2006; Muley. 2012; Natella. 2012 | you have to drink 3-5 cups per day) would occur with both the medium and dark roasts, but if we rely solely on the study at hand and the previously reported filtered- vs. unfiltered coffee (this is also scientifically confirmed based on observational studies | Muley. 2012) data, using medium roast coffee and a filter appears to be the most promising candidate for long-term health benefits from coffee consumption. This hypothesis is also warranted in view of the fact that the initial increase in total antioxidants that occurs with light roasting is reversed as the beans darken (del Castillo. 2002).
Against that background, you'd probably agree with Kerstin Kempf and her colleagues who thought it would be interesting to see "whether these effects on body weight would also be detectable after a longer-term consumption of dark roast coffee, in particular, in overweight adults" who are at the highest risk of dietary induced metabolic deteriorations (Kempf. 2015).
Figure 2: Flow sheet of recruitment and analysis (directly from Kempf. 2015)
In their randomized controlled trial, Kempf et al. compared the effect of 3-months consumption of (1) a medium roasted coffee blend rich in CQA and trigonelline versus a dark-roasted coffee blend rich in NMP (see Table 1 for the concentration of CQA, which is the sum of 3-, 4- and 5-caffeoylquinic acids, chlorogenic acid metabolites; NMP N-methylpyridinium, trigonelline and caffeine), as well as of (2) both groups combined for an estimate of general effects of coffee on body weight and selected cardiometabolic risk factors like HDL, LDL, triglycerides, adipokines (leptin, adiponectin), etc..
Table 1: Composition of medium roast (M)-coffee and dark roast (D)-coffee blends (Kempf. 2015).
What about filtered vs. unfiltered? The coffee in the Kempf study was handed to the subjects in regular commercially available coffee pads which look like coffee bagged in a filter. It is thus not surprising that similarly pronounced alterations in blood lipids as I've reported them before for unfiltered coffee, did not occur with either of the two roasts that were used in the study at hand.
During the study, the participants consumed an average of 4–5 cups per day of the roast they had been randomly assigned to. Even though that's probably more than the 500ml in the previously cited study by Kotcyzka et al. (see Figure 1) this was not enough coffee to exert significant effects on either the mean body weight, the body mass index or the waist circumference of the participants; and that's irrespective of whether the they consumed the dark (D) or medium (M) roast.
Figure 3: In contrast to the short-term cross-over study, the long(er) term study suggests that lighter roasts have the more beneficial effects on potentially CVD- (HDL + trigs) and T2DM (Trigs + Adiponectin) serum markers (Kempf. 2015).
Due to the different effects on some health-relevant metabolic markers, though, the study results are still SuppVersity news-worthy: In spite of the fact that the systolic blood pressure, which is obviously also a health relevant maker, decreased in the dark roast coffee group only (p < 0.05), other changes, in particular the contrast between
  • the significant increases in HDL and adiponectin, both of which have been linked to lower CVD and type II diabetes (T2DM) risk, which occurred in the medium roast group, and
  • the likewise significant increase in triglycerides, of which scientists believe that they pave the way for both diabetes and heart disease, which occurred only in the dark roast group,
would suggest health benefits of choosing lighter over darker roasts. How relevant those are for someone with perfect cholesterol and triglyceride levels may yet be questionable, also because neither of the two roasts affected the subjects' glucoregulation, or insulin levels (the scientists did observe an increase in the long-term glucose measure HbA1c (+0.1%), but this increase was identical in both groups and so marginal that it's hardly physiologically relevant).
If you look at the correlations between serum NMP levels (remember NMP is higher in dark roasts) the study confirms what the headline says: While darker roasts may favor weight loss (even though not necessarily sign. weight loss), it appears to have negative effects on leptin's healthy anti-diabetic and anti-CVD cousin adiponectin (Kempf. 2015).
So what? In contrast to the initially referenced study by Kotcyzka et al., the study at hand appears to confirm what previous studies on chlorogenic acid (CGA) already suggested (Thom. 2007; Onakpoya. 2015): Higher contents of CGA and/or its metabolites appear to be something to look for in both coffee extracts and regular coffee powder, because of their potential beneficial effects on blood glucose and CVD-markers.

The medium roast does after all not just contain more CGA metabolites, it does also have lower amounts of N-methylpyridinium, of which the study at hand clearly indicates that it is not just associated with weight loss (cf. Kotyczka, as well), but also w/ reduced adiponectin levels and overall less favorable effects on the few health-relevant changes the scientists observed during the study. It remains speculative, however, if said effects would have been different in (a) lean individuals (unlikely) or (b) subjects who don't belong to the ever-increasing group of regular coffee consumers (more likely), because the initial wash-out period during which the overweight subjects had to abstain from the consumption of coffee, cocoa, black or green tea probably didn't turn the coffee aficianados into caffeine naive coffee abstainers | Comment on Facebook!
References:
  • Crozier, Thomas WM, et al. "Espresso coffees, caffeine and chlorogenic acid intake: potential health implications." Food & function 3.1 (2012): 30-33.
  • del Castillo, María Dolores, Jennifer M. Ames, and Michael H. Gordon. "Effect of roasting on the antioxidant activity of coffee brews." Journal of Agricultural and Food Chemistry 50.13 (2002): 3698-3703.
  • Greenberg, James A., Carol N. Boozer, and Allan Geliebter. "Coffee, diabetes, and weight control." The American journal of clinical nutrition 84.4 (2006): 682-693.
  • Kempf, Kerstin, et al. "Cardiometabolic effects of two coffee blends differing in content for major constituents in overweight adults: a randomized controlled trial." European journal of nutrition (2014): 1-10.
  • Muley, Arti, Prasad Muley, and Monali Shah. "Coffee to reduce risk of type 2 diabetes?: a systematic review." Current diabetes reviews 8.3 (2012): 162-168.
  • Natella, Fausta, and Cristina Scaccini. "Role of coffee in modulation of diabetes risk." Nutrition reviews 70.4 (2012): 207-217.
  • Nicoli, M. C., et al. "Antioxidant properties of coffee brews in relation to the roasting degree." LWT-Food Science and Technology 30.3 (1997): 292-297.
  • Kotyczka, Christine, et al. "Dark roast coffee is more effective than light roast coffee in reducing body weight, and in restoring red blood cell vitamin E and glutathione concentrations in healthy volunteers." Molecular nutrition & food research 55.10 (2011): 1582-1586.
  • Onakpoya, I. J., et al. "The effect of chlorogenic acid on blood pressure: a systematic review and meta-analysis of randomized clinical trials." Journal of human hypertension 29.2 (2015): 77-81.
  • Thom, Erling. "The effect of chlorogenic acid enriched coffee on glucose absorption in healthy volunteers and its effect on body mass when used long-term in overweight and obese people." Journal of International Medical Research 35.6 (2007): 900-908.
  • Van der Stegen, Gerrit HD, Paulus JM Essens, and Joost Van der Lijn. "Effect of roasting conditions on reduction of ochratoxin A in coffee." Journal of Agricultural and Food Chemistry 49.10 (2001): 4713-4715.

Green Tea Supplement Boosts Resting & Exercise-Induced Fatty Acid Oxidation + Energy Expenditure - How Relevant is This for Losing Fat + Will it Impair Training Adaptations

$
0
0
"Yes", GTE will increase your total energy expenditure (TEE) and decrease the ratio of glucose to fat you're burning at rest and during your workouts, but "NO", it won't make your abs appear w/out dietin'.
You will remember that I am not exactly a fan of green tea extracts. In spite of the fact that there are studies that suggest reductions of both thyroid hormone and testosterone production, when you consume high(er) amounts, their anti-inflammatory effects appear to help (obese) people lose weight. In view of the fact that a recent study suggests that this does not interfere with the adaptational response to exercise, like vitamin C + E, for example (learn more), they are thus still among the most promising over-the-counter anti-obesity agents.

With that being said, the increase in fatty oxidation is often mentioned when people try to explain why green tea helps (obese) people lose fat.
You can learn more about tea at the SuppVersity

Use Roiboos for Stress & Virus Control

Water Temp. Influences Effects of Tea

Green Tea Can Reduce Your Testosterone

1L+ of Green Tea per Day Mess Up Your Thyroid

Aluminum, Lead & Arsenic & MORE in Your Tea

Will Drinking Tea Solve Your Sugar Problem?
As a SuppVersity reader, however, you know that a mere increase in the use of fats over carbohydrates will not translate into practical weight loss. Against that background it is important to investigate the effects of green tea extracts on both, the respiratory exchange ratio (RER), which is the quotient of glucose / fat that's used to fuel your basal and exercise-induced metabolic demands, as well as their effects on your total energy expenditure.

Luckily, a recent study from the Charles Darwin University and the University of New South Wales in Australia includes both measures of changes in RER, resting energy expenditure (REE) and the total energy expenditure (REE + activity induced energy expenditure).
Figure 1: Diagrammatic representation of the study design. * indicates blood collection. Lactate assessed at *1, *2, *4, *6, *9; catecholamines at *1, *4, *5, and glycerol at *1–*9 (Gahreman. 2015).
But that's not all. The scientists also took a look at the potential mediators of increased energy expenditure and fatty acid use like catecholamines and they did so in normal-weight young women (age: 21.5 +/- 0.5 years; body mass: 65.7 +/- 1.8 kg; BMI: 24.3 +/- 0.4 kg/m²; maximal oxygen consumption; VO2max): 32.1 +/- 1.7 mL/kg/min) and not the usual subjects: Overweight or obese post-menopausal women or male and female patients with type II diabetes.
Yes, it's official: Unlike vitamin C + E, GTE will not impair your gains! Ewa Jówko et al. (2015) were able to show that the consumption green tea extract (GTE) supplements in in dosages of only 245 mg polyphenols (including 200 mg catechins, among them 137 mg epigallocatechin-3-galate) does prevent the oxidative stress induced by repeated cycle sprint tests (RST) in sprinters without hindering the training adaptation in antioxidant enzyme system. What it does not do, either, is to decrease the exercise-induced muscle damage, or improve the sprint performance during the sprinters preparatory phase of their training cycle, though. Needless to say that studies involving different subject groups, dosages and training modalities would be required to eventually confirm that there are no anti-hormetic effects w/ GTE.
I have plotted the most relevant results of experiment the design of which is represented graphically in in Figure 1 for you in Figure 2. Please note that only the changes in VO2 which are indicative of an increased oxidation of fatty acids and the corresponding RER, the quotient of carbohdydrate oxidation and fat oxidation changed significantly.
Figure 2: Response at rest and during and after intermittent sprinting exercise in the green tea and placebo conditions; data expressed as relative differences between GTE and PLA (Gahreman. 2015).
It is thus all the more important to put the effects the consumption of three GTE (250 mg of camellia sinesis extract w/ 187.5 mg polyphenols, 125 mg EGCG) or placebo (cellulose) capsules the day before and one capsule 90 min before a 20-min intermittent sprinting exercise (ISE) cycling protocol consisting of
  • a 5-min warm-up at 30 W, and 20 min of ISE on a Monark Ergomedic 839E ergometer at 110 RPM during the sprint phase and 40 RPM during the recovery phase (pedal resistance for the sprint phase was calculated as 60% of each participant’s maximal power output) 
  • during which the subjects performed a total of sixty 8-s/12-s bouts totaling 8 min of sprinting and 12 min of easy pedaling recovery 
had on the metabolism of the fourteen untrained non-habitual coffee or green tea drinkers (< 2 cups per day) during the exercise, as well as before and after the ISE protocol:
Table 1: Mean power output, rating of perceived exertion, and lactate response to the sprinting and recovery components of the intermittent sprinting exercise for the placebo and green tea conditions (mean and SEM | Gahrmen. 2015).
  • There was a significant increase in fat oxidation post-exercise compared to at rest in the placebo condition (p < 0.01). 
  • After GTE ingestion, however, at rest and post-exercise, fat oxidation was significantly greater (p < 0.05) than that after placebo. 
  • Plasma glycerol levels at rest and 15 min during post-exercise were significantly higher (p < 0.05) after GTE consumption compared to placebo. 
  • There was no significant increase in total energy expenditure during or after exercise, though - that's in line with results Gregersen et al. (2009) generated in a study in normal-weight men, but different from some studies in normal-weight-to-moderately overweight men like Dullo et al. (1999) that report increases in TEE of ~2,8% over both, placebo and caffeine.
  • Compared to placebo, plasma catecholamines increased significantly after GTE consumption and 20 min after ISE (p < 0.05 | not shown in Figure 2). 
  • The effects are almost certainly not triggered by caffeine, because the capsules contained only 20mg of caffeine and previous studies have shown that only oral dose of more than 100 mg caffeine will elicit a significant increase in thermogenic response (Bracco. 1995; Dulloo. 1998 - suggest that 600-1,000mg/day is necessary for sign. increases in thermogenesis).
  • It's also worth noting that there were no significant differences in mean power output, RPE, lactate levels, RPM (Table 1), and HR levels between the GTE and placebo trials. This leaves little doubt that the effects were not mediated by direct ergogenic effects (= higher exercise performance / effort) in response to the GTE supplementation.
  • Lastly, it should be said that even though this was not tested in the study at hand, previous clinical trials like Bérubé-Parent et al. (2005) report identical thermogenic effects for low and high dosages of GTE. Thus, simply taking more GTE probably wouldn't have changed the results considerably.
Overall, the results of the study do thus support the ubiquitous claim that the ingestion of green tea extracts can significantly increase the fat oxidation at rest, during and after exercise when compared to placebo. In spite of the fact that the conclusion of the abstract to the study at hand makes it appear as if that was a practically highly relevant finding, there's one question neither the abstract nor the full-text of the paper actually address: Do the increase in fatty oxidation and the (albeit non-significant) increases in total and resting energy expenditure mean that consuming green tea extracts is going to help young, healthy, non-overweight women like the subjects in the study at hand lose body fat?
Figure 3: If you do the math and calculate the difference between the amount of energy the women would spend during a given week with 3x ISE sessions with and without GTE, the results are disappointing: The difference per week amounts to only 105.4kcal (1%), which is very unlikely to have a sign. effect on fat loss (calculated based on data from Gahreman. 2015).
Let's do some math to decide if the changes matter, or not... Ok, if they'd do the same ISE protocol three times a week and the increase in REE and TEE would not change over time, young, lean women who consumed GTE on a daily basis would burn an extra amount of only 105.4/kcal per week. That's a pathetic 1% increase of which I don't have to tell you that it is not only stat. not sign., but also practically irrelevant. In fact, this may well explain why you cannot expect green tea supplements to do the weight loss work for you. With the increases in fatty acid oxidation and energy expenditure being only two items on the list of purported anti-obesity benefits of GTE, the results of the study at hand do yet not necessarily mean that GTE supplements were totally useless. What they do mean, though, is that these supplements won't make young women lose body fat without the help of an energy restricted diet, which is still the indispensable backbone of any fat loss regimen.

In fact, specifically in the obese, the proven anti-inflammatory effects, as well as GTE's ability to reduce the absorption of both carbs and fats and to keep your appetite in check make it a viable addition to a reduced energy intake specifically in obese individuals (Hill. 2007; Rains. 2011). In view of the small increase in REE, but sign. impact on inflammation and glucose / lipid metabolism, specifically in the obese, it is thus  not surprising that meta-analyses report only a marginal association between green tea consumption and body weight on the population level, but significant beneficial effects on weight loss maintenance in overweight subjects after reductions in energy intake (Hursel. 2009) | Comment on Facebook!
References:
  • Bérubé-Parent, Sonia, et al. "Effects of encapsulated green tea and Guarana extracts containing a mixture of epigallocatechin-3-gallate and caffeine on 24 h energy expenditure and fat oxidation in men." British Journal of Nutrition 94.03 (2005): 432-436.
  • Bracco, David, et al. "Effects of caffeine on energy metabolism, heart rate, and methylxanthine metabolism in lean and obese women." American Journal of Physiology-Endocrinology and Metabolism 269.4 (1995): E671-E678.
  • Dulloo, A. G., et al. "Normal caffeine consumption: influence on thermogenesis and daily energy expenditure in lean and postobese human volunteers." The American journal of clinical nutrition 49.1 (1989): 44-50.
  • Dulloo, Abdul G., et al. "Efficacy of a green tea extract rich in catechin polyphenols and caffeine in increasing 24-h energy expenditure and fat oxidation in humans." The American journal of clinical nutrition 70.6 (1999): 1040-1045.
  • Gahreman, Daniel, et al. "Green Tea, Intermittent Sprinting Exercise, and Fat Oxidation." Nutrients 7.7 (2015): 5646-5663.
  • Gregersen, Nikolaj T., et al. "Effect of moderate intakes of different tea catechins and caffeine on acute measures of energy metabolism under sedentary conditions." British journal of nutrition 102.08 (2009): 1187-1194.
  • Hill, Alison M., et al. "Can EGCG reduce abdominal fat in obese subjects?." Journal of the American College of Nutrition 26.4 (2007): 396S-402S.
  • Jówko, Ewa, et al. "The effect of green tea extract supplementation on exercise-induced oxidative stress parameters in male sprinters." European journal of nutrition (2014): 1-9.
  • Phung, Olivia J., et al. "Effect of green tea catechins with or without caffeine on anthropometric measures: a systematic review and meta-analysis." The American journal of clinical nutrition 91.1 (2010): 73-81.
  • Rains, Tia M., Sanjiv Agarwal, and Kevin C. Maki. "Antiobesity effects of green tea catechins: a mechanistic review." The Journal of nutritional biochemistry 22.1 (2011): 1-7.

Creatine & Caffeine Don't Mix!? True or False? Recent Study Sheds *New* Light on an Important Supplement Question

$
0
0
Will a small cup of coffee ruin the benefits you can derive from creatine supplementation? Sounds impossible, but it's a die-hard rumor with surprising scientific backing. Now, a new study could finally settle the debate.
As topic for the thesis he submitted to the faculty of the University of North Carolina at Chapel Hill in partial fulfillment of the requirements for the degree of Master of Arts at the Department of Exercise and Sport Science (Exercise Physiology), Eric T. Trexler selected the "Effects of Creatine, Coffee, and Caffeine Anhydrous on Strength and Sprint Performance" (Trexler. 2015).

This is, as some of you will immediately recognize, at least in parts, a variation of the age-old question, whether the purported diuretic effects of caffeine would impair the proven ergogenic effects of creatine. In that, it's a variation, because the domain of concern is not - as it is for most bros - solely restricted to resistance training, but extends beyond the investigated one-rep max on the leg press and into the realms of sprint performance. But let's tackle things one after the other.
You can learn more about creatine at the SuppVersity

Creatine Doubles 'Ur GainZ!

Creatine, DHT & Broscience

Creatine Better After Workout

ALA + Creatine = Max Uptake?

How is Creatine Metabolized?

Build 'Ur Own Buffered Creatine
As Trexel points out, the study at hand "sought to directly compare effects of caffeine-matched (300 mg) doses of caffeine anhydrous [CAF | that's basically the same stuff you will have in your pre-workout] and coffee [COF | that's ~3 cups of the beverage that many of you will be drinking on a daily basis] on strength and sprint performance, and to determine if CAF or COF intake modulate the effects of creatine (CRE) loading" (Trexel. 2015 | my emphasis).

Now, you propably don't need a PhD to be able to tell that creatine and caffeine are currently among the most popular and best proven nutritional ergogenic aids. What is odd, though, is that supplement companies have made a habit of packing both into one product, even though there's the long-standing suspicion that caffeine may blunt the effects of creatine.
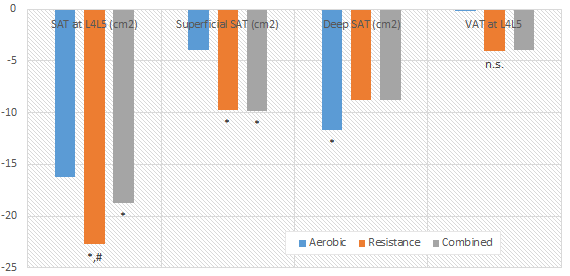
Figure 1: Caffeine blunts the beneficial effects of creatine loading on dynamic torque production (Vandenberghe. 1996).
And there are in fact a handful of people who still believe this was a huge mistake - mostly, because early studies into the concomitant administration of both agents like a Vandenberghe et al. (1996) clearly indicate that "caffeine counteracts the ergogenic action of muscle creatine loading" by (in this particular study) blunting the increase in dynamic torque production. This study, as well as a study by Hespel et al. who observed opposing effects of creatine and caffeine on the relaxation time of skeletal muscle (creatine decreases it, while caffeine increases it), are reason enough for skeptics like Tarnpolsky et al. (2010) to say that "there is no rationale for their simultaneous use" even though they have to admit that evidence is inconclusive:
"Although there is little rationale for taking both caffeine and creatine simultaneously as ergogenic aids, some have reported that the acute consumption of both negated the ergogenic benefits." (Tarnpolksy. 2010).
On the other hand, there are good reasons to be skeptical about the implications of the Vandenberghe and Hespel studies, too. It must be taken into consideration, for example that...
  • When is the best time to take your creatine supplement? Before or after your workouts? Learn more in this Suppversity Classic: "Lean Mass Advantage of Post- vs. Pre-Workout Creatine Supplementation Confirmed. Older Trainees Benefit Most" | more.
    the short term creatine loading protocol used in Vandenberghe's study is no longer recommended and the assumption that caffeine + creatine won't mix in the long-run would require studies that investigate that in the long run,
  • the study cross-over design of Vandenberghe's study in which the subjects received all three treatments in random order incorporated a 3-week washout period that was as follow up studies on the long-lasting effects of creatine supplementation suggest probably insufficient for the creatine levels to return to normal; after all, the minimal washout period for creatine is estimated to be ~4 weeks (Hultman. 1996)
  • the Vandenberghe study used only one exercise to test the effects and does therefore hardly reflect the effects on real-world athletic performance, 
  • lastly, many researchers have dismissed a potential interaction between creatine and chronic caffeine ingestion, because some of the early creatine studies with highly beneficial results have administered it dissolved in coffee/tea (Greenhaff. 1993; Birch. 1994); so have more recent studies that in which the effects of one of the previously mentioned nutraceuticals were tested (Smith. 2010; Lowery. 2013)
Against that background and in view of the fact that none of the long(er) term creatine supplementation studies that dominate the scientific landscape of the late 20th and early 21st century reports that coffee connaisseurs wouldn't let alone couldn't benefit from creatine supplements (Fukuda. 2010; Smith. 2010), the results of Vandenberghe's study would have to be reproduced even if there was no contradictory evidence from a 1998 study by Vanakosk et al. who observed no interaction between creatine and caffeine in their crossover study (Vanakosk 1998).
Where's the acute phase study data? While Trexel did an acute phase and a chronic supplementation study, I will not discuss the results of the acute phase study in detail, because the only effects Trexel observed in this part of the his experiment were (unsurprisingly)  the well-known beneficial effects of caffeine on acute exercise performance and even those were ... well, let's just say 'surprisingly inconclusive' - which means that I have seen much more significant benefits from caffeine in different experimental contexts (see Astorino. 2010 for a review).
To eventually find out if thousands of athletes competing in both aerobic and anaerobic sports are making a mistake, when they're pounding commercially prepared or self-made creatine + caffeine concussions, the initially mentioned study by Trexel was designed to find out if chronic coffee or caffeine anhydrous consumption blunts the ergogenic effect of creatine loading on strength and sprint performance outcomes.

Using subjects with previous resistance training experience, Trexel determined if caffeine (CAF) or coffeee (COF - both at 300mg caffeine per serving) intake modulates the effects of creatine (CRE) loading with 20 g/day, split between 4 servings by conducting the same battery of strength and sprint performance tests before and after the acute and chronic supplementation with coffee, creatine or caffeine or a combination of both (CRE + CAF or CRE + COF).

Unfortunately, the results of the by all means well-designed study are not clear enough to settle the debate once and for all even though, no inhibitory effects of caffeine or coffee on the ergogenic effects of creatine were observed. Personally, I'd say, though, that the total evidence would suggest that if there is an inteference, it's probably negligible in the long run.

But let's get back to the study at hand and what it tells or rather doesn't tell us about a possible interference: As you can see in 
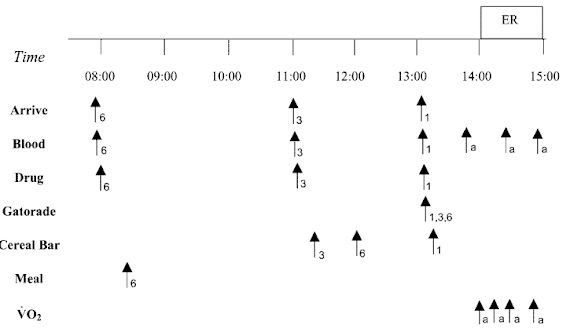
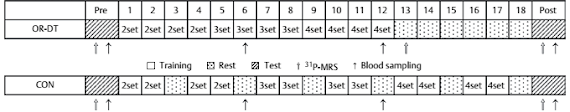
Figure 2, Trexel's study does not suffer from the same problems as the previously cited study by Vandenberghe. It's not a cross-over study, so too little washout time is not a problem. On the other hand, the number of subjects (13-14 in each group) is not exactly high enough to make sure that the differences you're expecting will be significant if you happen to have selected a few creatine non- or hyper-responders that mess with your data.
Figure 2: Overview of the study design for the chronic supplementation study (Trexel. 2015)
An additional problem is the total length of the study. With only 5 days, we are - once again - not in the practically more relevant longer-term chronic supplementation time-frame that would mimic the way most of you are probably using their creatine products. Yes, previous studies have shown significant effects even in a time-frame as short as that, but you will also know that creatine is not only one of the few supplements where the effects may accumulate over weeks, but also one of the few where long-lasting effects of previous (even way beyond the previously cited wash-out period) can be safely excluded. Against that background one could (I know you're always smarter after you've done a study, so no smart-assing here) argue that it may not have been enough to pick subjects that had not taken creatine in the last three moths, but were not necessarily creatine naive.
What distinguishes creatine responders from non-responders? This question has still not been satisfactorily answered, but evidence from a 2004 study by Syotuik et al. indicates that different baseline creatine levels, the total muscle mass and the ratio of fast- to slow-twitch may determine whether you're going to see huge gains or no effect at all. To be more precise, Syotuik et al.'s observation suggest that ideally, you'd have a low baseline creatine level, lots of lean muscle and a high number of fast-twitch muscle fibers.
Yes, I know, being "creatine naive" does not sound like it could be important, but but in view of the anecdotal evidence that no "creatine cycle is as effective as the first one" as well as the scientific evidence that one's baseline creatine levels have a significant effect on whether you "respond" or "don't respond" to supplementation (Syrotuik. 2004 | see red box, as well), it could at least partly explain why the results of the study are somewhat inconclusive.
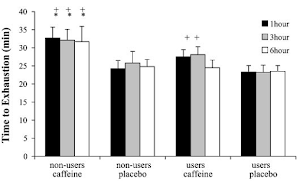
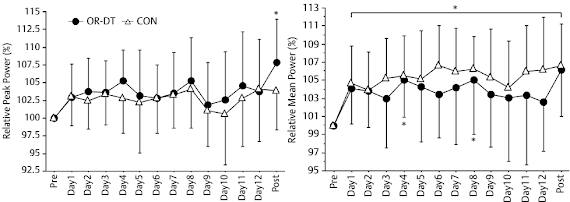
Figure 3: If we go by serum creatine levels it would seem as if caffeine wasn't a problem - specifically if it comes from coffee. Unfortunately, serum creatine is pretty irrelevant and the performance data in form of changes in total work and the number of reptitions on the leg press and bench showed no signifant intergroup difference. Now this would suggest that it's not problem to take creatine with coffee or caffeine, but convincing evidence that caffeine does not impair the beneficial effects of creatine would require these beneficial effects to show (data after chronic suppl. from Teaxel. 2015).
And with "inconclusive" I am attributing the data in Figure 3 which tells you - more than anything else - that neither creatine norcaffeine produced a significant performance increase in any of the relevant parameters over the five-day study period.

Only the increase in plasma creatine was statistically significant. That's nice, because it shows that mixing your creatine into instant coffee, which is what the guys in the coffee + creatine group were told to do, appears to rather boost than hamper the intestinal absorption of creatine. Eventually, however, this information is irrelevant, because it is the increase in intramuscular phosphocreatine stores that's driving the (not observed) performance benefits - not an increases in serum creatine.
Another die-hard creatine myth based - just like the myth from the study at hand - on the results of a single study (and this time without rational hyopthesis to explain the results) is that creatine would increase DHT and thus trigger hair loss and prostate cancer | Learn more about this bogus.
So are we left with nothing? Not exactly, after all, the study confirmed that caffeine and coffee both have their merit as acute phase ergogenics. It's correct, though, that this does not tell us, if caffeine will blunt the beneficial effects of creatine in either the short or the long run. In this respect, we are thus about as wise as before; and that in spite of the fact that Trexel is obviously right when he writes that "[t]he addition of CAF and COF did not appear to influence performance outcomes of CRE supplementation" (Trexel. 2015). In view of the fact that no significant effects of creatine supplementation were observed, we still need future long(er) term studies that combine coffee / caffeine + creatine and tests it against placebo and creatine alone - maybe even in different dosages - to answer the question whether it does or doesn't matter if you consume caffeine when you're "on" creatine once and for all | Comment on FB!
References:
  • Astorino, Todd A., and Daniel W. Roberson. "Efficacy of acute caffeine ingestion for short-term high-intensity exercise performance: a systematic review." The Journal of Strength & Conditioning Research 24.1 (2010): 257-265.
  • Birch, R., D. Noble, and P. L. Greenhaff. "The influence of dietary creatine supplementation on performance during repeated bouts of maximal isokinetic cycling in man." European journal of applied physiology and occupational physiology 69.3 (1994): 268-270.
  • Fukuda, David H., et al. "The possible combinatory effects of acute consumption of caffeine, creatine, and amino acids on the improvement of anaerobic running performance in humans." Nutrition research 30.9 (2010): 607-614.
  • Greenhaff, Paul L., et al. "Influence of oral creatine supplementation of muscle torque during repeated bouts of maximal voluntary exercise in man." Clinical Science 84 (1993): 565-565.
  • Hespel, Peter, B. Op‘t Eijnde, and Marc Van Leemputte. "Opposite actions of caffeine and creatine on muscle relaxation time in humans." Journal of Applied Physiology 92.2 (2002): 513-518.
  • Hultman, E., et al. "Muscle creatine loading in men." Journal of applied physiology 81.1 (1996): 232-237.
  • Lowery, Ryan P., et al. "Effects of 8 weeks of Xpand® 2X pre workout supplementation on skeletal muscle hypertrophy, lean body mass, and strength in resistance trained males." J Int Soc Sports Nutr 10.1 (2013): 44.
  • Smith, Abbie E., et al. "The effects of a pre-workout supplement containing caffeine, creatine, and amino acids during three weeks of high-intensity exercise on aerobic and anaerobic performance." J Int Soc Sports Nutr 7.10 (2010): 10-1186.
  • Syrotuik, Daniel G., And Gordon J. Bell. "Acute Creatine Monohydrate Supplementation: Adescriptive Physiological Profile Of Responders Vs. Nonresponders." The Journal Of Strength & Conditioning Research 18.3 (2004): 610-617.
  • Tarnopolsky, Mark A. "Caffeine and creatine use in sport." Annals of Nutrition and Metabolism 57.Suppl. 2 (2010): 1-8.
  • Trexler, Eric T. Effects of creatine, coffee, and caffeine anhydrous on strength and sprint performance. Diss. THE UNIVERSITY OF NORTH CAROLINA AT CHAPEL HILL, 2015.
  • Vanakoski, Jyrki, et al. "Creatine and caffeine in anaerobic and aerobic exercise: effects on physical performance and pharmacokinetic considerations." International journal of clinical pharmacology and therapeutics 36.5 (1998): 258-262.
  • Vandenberghe, K., et al. "Caffeine counteracts the ergogenic action of muscle creatine loading." Journal of applied physiology 80.2 (1996): 452-457.

Overreaching A Promising, But Tricky Training Strategy - Here's How it Rewards Pains & Effort With 5% Higher Peak Power Gains After 12 Workout vs. Training W/ Adequ. Rest

$
0
0
No rest(-day) allowed - at least during the short (!) overreaching phase you will be training through the pain & fatigue if you are determined to succeed.
You've read about the difference between the catabolic, anti-adaptive effects of overtraining and overreaching before, but do you actually know what it takes to overreach not train? In a recent study from the Ritsumeikan University you may find some clues that may help us answer these questions, but before we do so, let's take a brief look at the study design and outcomes, the authors give away in the title already: "Planned Overreaching and Subsequent Short-term Detraining Enhance Cycle Sprint Performance" (Hasegawa. 2015) - A study designed to investigate the effects of a training program consisting of planned overreaching and subsequent short-term detraining on sprint performance.
You can learn more about overtraining and checking your training status at the SuppVersity

Heart Rate Variablity (HRV)

ABEL Sports Test + More

Overtraining & Undereating

Calculate your Energy Intake!

Overtraining W/ Only 25min/day?

Reinvent Your Training!
Over the course of the three-week (*) study, 24 physically active men (age, height, and body weight (BW) were 21.7 ±1.4 years, 175.2±4.3cm, and 75.0± 14.6kg, respectively) participated in an 18-day sprint-training program. None of the subjects was participating in a regular training program (*) at the start of the study, when they were randomly allocated to one out of two training groups:
  • the overreaching-detraining (OR-DT), in which the subjects performed maximal cycle sprint training on 12 consecutive days, followed by 6 days of detraining (=no exhausting physical activity at all | like 12xA - 6xR) and 
  • the control (CON) group, in which a complete day of rest was provided after every 2 successive training days (like A-A-R-A-A-R- [...])
For both groups, the training sessions consisted of 2–4 sets of 30 s of maximal pedaling on an electromagnetic cycle ergometer (Powermax V3, Konami Sports & Life Co., Ltd., Tokyo, Japan). Each set was followed by a 7-min rest period. The resistance for the first set was set 7.5% of BW, and it was reduced to 5.0 % of BW for the subsequent sets. During each training session, the subjects were verbally encouraged and instructed to give their maximal effort.
Figure 1: Overview of the study design - Training schedules and number of sets (Hasegawa. 2015).
You can see a summary of the protocol in Figure 1 and may (maybe rightly) complain that the OR-DT group got more rest before the post-test on day 18 than the CON group.
What do we already know about overreaching? Unfortunately, we don't know how to make sure it's not turning from overreaching to overtraining, but that's one of the many questions scientists will still have to answer (Mackinnon. 2000). What we do know, though, is supplements like creatine or 0.4g/kg body weight EAAs and likely whey can help conserve the performance during and thus improve the outcome after overreaching periods (Ratamess, 2003; Volek. 2004). We also know that overreaching attenuates the testosterone response to workouts in untrained, but not trained individuals and A.M. cortisol, but no the cortisol response to workouts in both trained and untrained subjects (Fry. 1994). Both, the amount of creatine kinase and glutamate in the blood which can be used as indicators of muscle damage increase during periods of overreaching (Halson. 2003). Lastly, the changes in the immune markers indicate that athletes may be particularly prone to infections during phases of extra-(=too)intense training (Gleeson. 2002).
That's truly unfair, but it's the reality of competitive sports (*). After all, you have the choice of training like the control group before the event to make sure that you're full of sap or, alternatively, to follow the OR-DT program and start on game day maximally refreshed and with an adaptational bonus in the peak-power domain that may make all the difference when you're sprinting towards and over the finish line (see Figure 2). 
Figure 2: Relative peak power and mean power during the pre- and post-test days as well as on the differently timed training days in the OR-DT and CON group (Hasegawa. 2015).
Now, I guess the less-regular SuppVersity readers will be surprised to hear that all that happened in spite of the lack of significant differences in the testosterone levels, markers of muscle damage, lactate and glucose in the blood of the subjects in the two arms of the study. 
The supercompensation of phospho-creatine stores may also explain the power gains in the overreaching + detraining group (Haegawa. 2015), but still, do not underrate the ergogenic benefits of the stress hormone cortisol - it's on the WADA list for very good reasons, esp. wrt endurance sports!
What's powering these peak performance gains? Ok, one thing is discussed below in detail: The 6-days of rest allowed for sign. higher cortisol outputs during the test and that's actutely a good thing. There's yet more: The intra-muscular phosphocreatine concentrations, the same stuff you wanna boost, when you consume creatine, which were not different before the study, developed very differently over the course of the study. While the intramuscular PCr concentrations increased significantly after 12 days of daily training in the OR-DT group (P<0.05, 69 % increase relative to value before training, described as "Post 1" in the Figure on the left, the CON group subjects saw no change in PCr, at all. With it's ability to fire short term high performance bouts, the PCr advantage may also be at the heard of the relative preak power benefits of OR-DT group.
For regular SuppVersity readers this should be as unsurprising, though as the fact that the OR-DT's ability to maximize their cortisol response at the post test is probably (one of the) reasons that they kicked their competitions a$$ when it comes to peak performance... unbelievable? 
Figure 3: Cortisol levels in the Hasegawa study (2015) in the pre- and post-test (left); maximal endurance (T in min) in Katia Collomp's 2008 investigation into the effects of acute glucocorticoid administration on cycling endurance (right).
Well, take a look at the endurance performance of the cyclists in Katia Collomp's 2008 study (Figure 3, right) - what did almost double the endurance of her subjects? Yes, it was synthetic cortisol - prednisolone at a dosage of 60mg to be precise. And just as it is important to point out that these benefits are restricted to acute short term increases, it is noteworthy, that, in the Hasegawa study, the cortisol response during the over-reaching phase was as, if not more blunted as it was in the CON group.
SV Classic: "Optimal Rest Between Workouts? Despite Inter-Personal and Exercise-Specific Differences 72h May be a Valid Rule of Thumb - Especially for Compound Movements" | more
(*) What do these asterisks mean and what's the bottom line? Two good questions which are, as I would like to point out closely related. How? Well, let's take the training duration of only 18 days, for starters. The easiest way to turn overreaching into overtraining and thus all beneficial short-term into long-term negative effects is by overreaching for too long. And two weeks are in fact  quite a good time-frame to train like a maniac and complete rest for ~50% of the time thereafter doesn't look like a bad way to program it either. If you go longer, the increased activity of glycolytic and other catabolic enzymes, as it was observed by Parra et al. (2000) after 14 day of everyday, no rest incremental sprint training protocols, may ruin your results and fitness.

Unfortunately, there's also asterisk (*) number two you will find right after the information that we are not dealing with professional athletes. That's a problem, because it is unlikely that the ordeals a seasoned athlete can sustain and still gain are the same as those of a rookie. This does not mean that everyone needs more or longer hammering, though. In fact, many athletes are chronically overtrained. For them (Matos. 2011), the 6-day rest may be a good idea; to try to increase their performance by strategic overreaching,on the other hand, would be madness and obviously counter-productive.

Overtraining is real and it's blocking future and reversing past gains | more
This leads us to asterisk (*) number three and two conclusions: (A) There is no question that the protocol used in the study would have beneficial for the participants had there been a cycling competition on the post-training day. (B) The implications for professional athletes depend on their previous training style. For those on a sane protocol, similar benefits can be expected, although intensity and duration of the overreaching phase may have to be upgraded (I am thinking of doing two-a-days, for example). For the underestimatedly large fraction of (wanna-be) athletes who are chronically overtraining, anyways, any form of strategic overreaching would be counterproductive | Comment on FB!
References:
  • Collomp, Katia, et al. "Short-term glucocorticoid intake combined with intense training on performance and hormonal responses." British journal of sports medicine 42.12 (2008): 983-988.
  • Fry, Andrew C., et al. "Endocrine responses to overreaching before and after 1 year of weightlifting." Canadian Journal of Applied Physiology 19.4 (1994): 400-410.
  • Gleeson, Michael. "Biochemical and immunological markers of over-training." Journal of sports science & medicine 1.2 (2002): 31.
  • Halson, SHONA L., et al. "Immunological responses to overreaching in cyclists." Medicine and science in sports and exercise 35.5 (2003): 854-861.
  • Hasegawa, Y., et al. "Planned Overreaching and Subsequent Short-term Detraining Enhance Cycle Sprint Performance." International journal of sports medicine (2015).
  • Mackinnon, L. T., and S. L. Hooper. "Overtraining and overreaching: Causes, effects and prevention." (2000): 487-498.
  • Matos, Nuno F., Richard J. Winsley, and Craig A. Williams. "Prevalence of nonfunctional overreaching/overtraining in young English athletes." Med Sci Sports Exerc 43.7 (2011): 1287-94.
  • Parra, J., et al. "The distribution of rest periods affects performance and adaptations of energy metabolism induced by high‐intensity training in human muscle." Acta Physiologica Scandinavica 169.2 (2000): 157-165.
  • Ratamess, Nicholas A., et al. "The effects of amino acid supplementation on muscular performance during resistance training overreaching." The Journal of Strength & Conditioning Research 17.2 (2003): 250-258.
  • Volek, Jeff S., et al. "The effects of creatine supplementation on muscular performance and body composition responses to short-term resistance training overreaching." European journal of applied physiology 91.5-6 (2004): 628-637.

True or False? Losing Your Weight Slowly Will Yield Better (Long-Term) Results Than Rapid Weight Loss - Another Common Weight Loss Myth Debunked by Science?!

$
0
0
With adequ. protein and nutrients "crash"- beats "low and steady" -dieting. In the obese that's almost certain, in athletes more experimental evidence are needed.
You will have heard and read that rapid weight loss will make you lose muscle and set you up for weight regain aka the "Yo-Yo effect". As a SuppVersity reader, you know that things are not as simple as that. While some studies appear to support this urban myth others suggest that the exact opposite may be the case.

A 2014 study by Purcell, Sumithran, and Prendergast that was published in the venerable scientific journal The Lancet for example, showed that rapid weight loss on a very low calorie diet leads to better long-term outcomes than gradual weight loss on a much less restricted diet.
You can learn more about improving your body composition at the SuppVersity

Long-Term Dieting Makes Gymnasts Fat!

Minimal Carb Reduction, Max. Results?
HIT Circuit + Plyos for Glucose Management

How Much Carbs Before Fat is Unhealthy?

5 Tips to Improve & Maintain Insulin Sensitivity

Carbohydrate Shortage in Paleo Land
That's a results of which I feel that it is important enough to re-address ii in its own SuppVersity article. After all, the "slow and steady" advise is still ubiquitous, both in the mainstream and in the health and fitness community. In said study, Purcell et al.
"aimed to investigate whether the rate of weight loss affects the rate of regain, and whether weight lossinduced changes in circulating appetite-mediating hormones and subjective appetite are affected by the rate of weight loss" (Purcell. 2012).
To this end, the researchers from the University of Melbourne conducted a two-phase, non-masked, randomized controlled trial. The study participants were recruited through radio and newspaper advertisements and word of mouth in Melbourne, Australia.
  • Inclusion criteria were healthy men and women aged between 18–70 years who were weight stable for 3 months and had a BMI between 30.0–45.0kg/m². 
  • Exclusion criteria included use of a very low energy diet or weight loss drugs in the previous 3 months, contraceptive use, pregnancy or lactation, smoking, current use of drugs known to affect body weight, previous weight loss surgery, and the presence of clinically significant disease (including diabetes).
Eligible participants were randomized into 2 different weight loss programs — a 12-week rapid program or a 36-week gradual program —using a computer-generated randomization sequence with a block design to account for the potential confounding factors of age, sex, and body mass index (BMI). Investigators and laboratory staff were blind to the group assignments.
Figure 1: Overview of the study design (Purcell. 2014)
Both, the subjects on the rapid and the gradual weight loss program had the same simple goal: "Reduce your body weight by at least 12.5%." The way the subjects were supposed to achieve this weight loss was yet completely different. For phase 1 of the study (until 12.5% weight loss), the following interventions were prescribed:
  • Better ZERO than Some Food? Study Suggest Just That! Learn more.
    Rapid weight loss: Participants in the rapid weight loss group replaced 3 meals a day with a commercially available meal replacement (Optifast, Nestlé Nutrition) over a period of 12 weeks (450–800 kcal/day). 
  • Gradual weight loss: Participants in the gradual group replaced 1 to 2 meals daily with the same supplements and followed a diet program based on recommendations from the Australian Guide to Healthy Eating for the other meals over a period of 36 weeks (400–500 kcal deficit per day).
Both groups were given comparable dietary education materials and had appointments every 2 weeks with the same dietician. Participants who achieved 12.5% or greater weight loss were eligible for phase 2. In phase 2, participants met with their same dietician at weeks 4 and 12, and then every 12 weeks until week 144. During appointments, the dietician assessed adherence based on participants' self-reported food intake, and participants were encouraged to partake in 30 minutes of physical activity of mild to moderate intensity. Participants who gained weight were told to reduce their energy intake by 400–500 kcal in order to get back on the weight loss track.
High(er) protein intake (1.2-1.4g/kg) are a way to make very low calorie diets, here fasting vs. protein modified fasting, more effective (Iselin. 1982).
Wait, but what about all the other studies? Well, in their research review, Purcell et al. "found no randomised clinical trials" which even investigated the difference. Practically speaking, this means that the general consensus which is that weight loss should happen gradually and at a rate of 0.5 kg per week is more or less arbitrary (from a science perspective). If you look more closely, though, you will find acute weight loss studies without appropriate follow up you could use as evidence in favor of dieting down slowly - mostly for decreased muscle loss in low (=RDA) protein diet scenarios, though. With adequate protein intakes, said studies yielded very different results - e.g. protein-modified fasts (see Figure | Bistrian. 1977; Iselin. 1982).
To assess the success of the diets, the scientists used the mean weight loss that was maintained at week 144 of phase 2 (primary outcome), the mean difference in fasting ghrelin and leptin concentrations measured at baseline, end of phase 1 (week 12 for rapid and week 36 for gradual), and at weeks 48 and 144 of phase 2, as well as the overall changes in weight, BMI, waist and hip circumferences, fat mass, fat free mass, ghrelin, leptin, and physical activity (secondary outcomes).
Figure 2: Percent of participants achieving the weight loss target in phase 1 completers (left) and all subjects including the losers who didn't complete the full study - that the right figure shows even greater differences actually supports the superiority of the rapid vs. gradual weight loss regimen (p = 0.0001 | Purcell. 2015)
The overall message of the results was clear, the "rate of weight loss does not affect the proportion of weight regained within 144 weeks" (Purcell. 2014). The same goes for the implication that "[t]hese findings are not consistent with present dietary guidelines which recommend gradual over rapid weight loss, based on the belief that rapid weight loss is more quickly regained" (ibid).
Figure 3: Relative changes in measures body composition (left) and activity from pre- to follow up (Purcell. 2015).
But this wouldn't be the SuppVersity if we didn't go beyond the mere averages for the main study outcomes. So, let's take a look at the actual changes from the pretest to the follow up in Figure 3. What do you see? Yes, the rapid weight loss group had better (albeit not significantly better) results in everything and that despite the fact that they didn't increase their physical activity (see Figure 2, right). So let's not forget that this information that's missing from the abstract, when we're discussing the "bottom line" to this article in the following paragraphs.
So, fast and furious (weight loss) is always the better choice? I would not necessarily say so, but as Martin et al. point out in a comment on Purcell's study we cannot simply ignore that (a) fewer participants dropped out early in the rapid weight loss group than in the gradual weight loss group, and that (b) during phase 1, more participants in the rapid weight loss group achieved the target weight loss of 12.5% than in the gradual weight loss group (81% vs 62%).

It would be stupid to blindly stick to the mantra that "slow and steady is always better" if evidence from well-designed clinical human trials says the opposite. Specifically, if we also take into account that ...
  • Nacker's re-analysis of the TOURS study shows similar results. Subjects who lost weight fasted had the best short+long-term results.
    the subjects who had far less time to achieve the same energy deficit, showed no evidence of relative increases in the adaptational processes like higher levels of the hunger or the "hunger hormone" ghrelin, which are believed to hinder long-term weight loss success
  • despite the fact that both groups regained a similar amount of weight, the subjects in the rapid weight loss group, who used a very low calorie diet in phase 1, still had better outcome in both, the short and long run (n.s. difference), compared with those in the gradual weight loss group, who used a moderate caloric deficit.
There's thus no reason to question Purcell's conclusion that very low calorie diets can encourage adherence, weight loss, and retention. In that, it is interesting to point out that...
  • very low calorie diets restrict food variety which can actually promote greater satiety and less food intake compared with diets that have more food variety (Rolls. 1984), and
  • very low calorie diets are not complex to follow, have simple rules, limit choice,  and essentially eliminate the need for participants to measure or estimate portion size, an endeavour associated with error (Martin. 2007)
In addition, the rapid weight loss success on very low calorie diets is, as Martin et al. rightly point out, "presumably intrinsically rewarding and builds self-efficacy because behaviour change is proximally associated with a large and meaningful reward" (Martin. 2014).

Chronic Energy Deficits Make Athletes Fat - The Longer You Starve, the Fatter You Get. No Matter What the Calories-in-VS-Calories-Out Equ. Says
If the known and manageable downsides, which are a potential lack of adequate protein and essential micronutrients, or constipation are taken care of and the length and frequency of the interventions is reasonable (e.g. 8-12 weeks depending of the amount of superfluous body fat with 4-6 weeks breaks between cycles), there's no reason to doubt that rapid weight loss on adequately designed very low calorie diets will yield better results than the "slow and steady" approach in the obese. Evidence from studies in athletes is mixed: On the one hand, there are profound detriments from longterm-deficits and no harm from appropriately plannedshort-term severe calorie restriction. On the other hand there are potential performance decrements (Mero. 2010) without negative effects on body composition and a single study suggesting that deficits of only 9kcal/kg (vs. 15kcal/kg) may allow for muscle gains even while dieting (Garthe. 2011) and thus be superior to taking the "fast track".

So, while it appears quite clear that obese individuals can benefit from losing weight rapidly, there's a paucicity of evidence for athletes and very lean individuals... but even if we had these study, this wouldn't change that what's optimal for you will depend so much on your personal preferences, your lifestyle, your sport, your current body fat levels etc. that there's no general one-size-fits-it-all recommendation. What's important, though, is not to get stuck in the "ONLY SLOW AND STEADY WILL WORK" mantra. Especially if you're not ripped (yet) doing the exact opposite and doing it cyclically may be the better choice | Comment on Facebook!!
References:
  • Bistrian, B. R., and Mindy Sherman. "Results of the treatment of obesity with a protein-sparing modified fast." International journal of obesity 2.2 (1977): 143-148.
  • Garthe, Ina, et al. "Effect of two different weight-loss rates on body composition and strength and power-related performance in elite athletes." International journal of sport nutrition and exercise metabolism 21 (2011): 97-104.
  • Iselin, Hans U., and Peter Burckhardt. "Balanced hypocaloric diet versus protein-sparing modified fast in the treatment of obesity: a comparative study." International journal of obesity (1982).
  • Martin, Corby K., et al. "Empirical evaluation of the ability to learn a calorie counting system and estimate portion size and food intake." British Journal of Nutrition 98.2 (2007): 439-444.
  • Martin, Corby K., and Kishore M. Gadde. "Weight loss: slow and steady does not win the race." The Lancet Diabetes & Endocrinology 2.12 (2014): 927-928.
  • Mero, Antti A., et al. "Moderate energy restriction with high protein diet results in healthier outcome in women." J Int Soc Sports Nutr 7.4 (2010): 1-11.
  • Nackers, Lisa M., Kathryn M. Ross, and Michael G. Perri. "The association between rate of initial weight loss and long-term success in obesity treatment: does slow and steady win the race?." International journal of behavioral medicine 17.3 (2010): 161-167.
  • Purcell, Katrina, et al. "The effect of rate of weight loss on long-term weight management: a randomised controlled trial." The Lancet Diabetes & Endocrinology 2.12 (2014): 954-962.
  • Rolls, Barbara J., P. M. Van Duijvenvoorde, and Edmund T. Rolls. "Pleasantness changes and food intake in a varied four-course meal." Appetite 5.4 (1984): 337-348.

Paleo Goes "Real Science" - First Meta-Analysis of Available RCTs Shows Improvements in Health + Body Composition

$
0
0
The good thing about paleo is that you can eat a broad range of foods. An advantage that makes paleo versatile and tasty enough to adhere to.
I know that I will probably have annoyed some of you by implicitly calling "paleo" non-scientific. If we are honest, though, the whole paleo concept is based on extrapolating data from modern hunter gatherer populations, infusing them with a minimal amount of real evidence of what our ancestors ate and mixing that with the intrinsically flawed assumption that the way our ancestors ate (which was 100% opportunistic and 0% "optimized") was the optimal way for us to eat... and no, I am not going to apologize for what some of you may consider an assault on respected scientists who have published more than a dozen of papers which constitute the theoretical backbone of an experimentally still mostly unverified, but promising approach to "healthy dieting".
Meat is an essential part of the "paleo diet" | Learn more about meatat the SuppVersity

You May Eat Pork, too!

You Eat What You Feed!

Meat & Prostate Cancer?

Meat - Is cooking the problem

Meat Packaging = Problem?

Grass-Fed Pork? Is it Worth it?
Just to make sure there's no confusion. I am not saying that everything that Eaton, Cordain and others wrote is bogus. I am just saying that their papers are above everything else the material based on which others have formulated research hypothesis and done experimental research. Research that has been reviewed in a soon-to-be-published paper in the influential American Journal of Clinical Nutrition, by Eric W Manheimer, Esther J van Zuuren, Zbys Fedorowicz, and Hanno Pijl. A paper that leaves its readers with a generally positive conclusion, but state that "[t]he available data warrant additional evaluations of the health benefits of Paleolithic nutrition" (Manheimer. 2015). Now that does not sound like much, but in view of the scarcity of evidence it is more than you'd usually expect from a review that was partly financed by the National Center for Complementary and Alternative Medicine of the US.

When they decided on the methodology, inclusion and exclusion criteria, Manheimer et al. began with the simple, but important question "Does paleo-nutrition improve risk factors for chronic disease more than other dietary interventions in people with the metabolic syndrome?" To answer this question, the authors searched the following bibliographic databases for reports of controlled trials without any language restriction (likewise included were relevant results from the following ongoing trials databases):
  • Figure 1: Details of the selection process in January 2015 (Manheimer. 2015).
    The Cochrane Central Register of Controlled Trials (CENTRAL) 2014
  • MEDLINE via OVID (from 1946)
  • EMBASE via OVID (from 1974)
  • LILACS (Latin American and Caribbean Health Science Information database, from 1982)
  • Science Citation Index (from 1988 to the present).
  • The metaRegister of Controlled Trials 
  • The U.S. National Institutes of Health Ongoing Trials Register
  • The Australian and New Zealand Clinical Trials Registry 
  • The World Health Organization International Clinical Trials Registry platform 
The reference lists of all identified RCTs and key review articles were also reviewed and squared with the following selection criteria:
"Randomised controlled trials will be included. Any other study design will be excluded. We will only include cross-over trials if we are able to extract the relevant data from the first phase (i.e., before the crossover occurred) because we consider the risk for carryover effects to be prohibitive" (Manheimer. 2015).
In addition, the scientists looked for dietary interventions which were designed to emulate as much as possible, for the modern time, the diet of plants and animals eaten by human beings during the Paleolithic era. More precisely, Manheimer et al. included only studies with diets with...
  • large amounts of vegetables (including root vegetables), 
  • fruits (including fruit oils e.g., olive oil, coconut oil, palm oil), 
  • nuts, fish, meat, and eggs
To make sure to get relevant data, the duration of the dietary intervention had to be at least one week. Studies showing only acute improvement in blood pressure, glucose levels or whatever from eating more veggies and fruit and calling that "the paleo diet" were thus not included in the meta-analysis. The same goes for two uncontrolled clinical trials, as well as all studies where the dietary protocols included one or several of the following "paleo-nono-foods": dairy, grain-based foods, legumes, extra sugar, nutritional products of industry (including refined fats, refined carbohydrates).
This is the macronutrient composition (in g/day) of what Eaton describes as the "paleo diet" in his 1985 seminal paper - needless to say that this is based solely on hypothetical extrapolations of sample data from modern hunter gatherer populations and the little actual evidence we have of what our ancestors ate (Eaton. 1985).
So what's paleo, and what was it compared to? For those who are too lazy to read the full article, here's the gist. The "paleo diets in the four RCTs that were analyzed in Manheimer's meta-analysis used diets that were high in vegetables (including root vegetables), fruits (including "fruit oils", i.e. olive oil, palm oil, coconut oil) and nus, fish, meat and eggs. Dairy, grains, legumes, extra-sugar and processed foods were a no-go in all studies Manheimer et al. included in their analysis. The control diets in all 4 RCTs that were concluded in the meta-analysis were based on distinct national nutrition guidelines, but still broadly similar. Obviously that's interesting, because the results of this meta-analysis are thus going to be a comparison of the "paleo diet" and the recommended "healthy diet" according to what experts on certain advisory boards think would be the one and only way for us to eat.

Important side note: I would like to use the chance to highlight that this diet - if it was not for the (imho) unnecessarily rigid exclusion of dairy and legumes - is actually very similar to what fitness experts have been suggesting for decades. If you do the math on the macros in Eaton's recommendation you end up with 32.5% protein, 22.8% fat, 43.7% carbohydrates and the rest of the energy in form of fiber. With this common macro ratio from the fitness community and the requirement to "get all of that from whole foods" you end up eating almost the same diet.
The number of studies all these search efforts brought to light was - as you, as someone who's heard about all the pertinent trials on www.facebook.com/SuppVersity, already, will know - not exactly extensive. All in all, only four RCTs that involved 159 participants were included. This were four RCTs with very similar results, as the researchers' meta-analysis revealed:
"In this systematic review and meta-analysis of 4 RCTs, Paleolithic nutrition resulted in greater short-term pooled improvementson each of the 5 components of the metabolic syndrome than did currently recommended guideline-based control diets. However, the greater pooled improvements did not reach significance for 2 of the 5 components (i.e., HDL cholesterol and fasting blood sugar). For each metabolic syndrome component, the quality of the evidence for the pooled estimate for improvement was moderate" (Manheimer. 2015).
I guess what these results mean is much easier to grasp if you take a look at the plot of the data I've created for you. Keep in mind: What you see in Figure 1 are the differences compared to the allegedly "optimal" recommended diets in the respective studies, not differences to the habitual diets of the subjects which were probably significantly more pronounced.
Figure 2: Improvements in  triglycerides, HDL, fasting blood sugar, waist circumference, systolic and diastolic blood pressure with "paleo" diets vs. nationally recommended diets (Manheimer. 2015).
The most significant and probably practically relevant benefits of the paleo diet can be seen in the graph on the right hand side: Compared to the relatively small (and practically probably almost irrelevant, if not already stat. non-significant) advantages in terms of blood lipids and glucose, the improvements in blood pressure and waist circumferences are what I would use to argue in favor of paleo-esque dietary recommendations in front of any expert panel.
Meat vs. beans - what's more satiating? A recent study from the University of Minnesota did a "paleo-relevant" comparison of the satiety effects of meat- and bean-based meals. More specifically, Bonnema and her colleagues compared the satiety response to a beef meal providing 26 g of protein and 3 g of fiber to a bean meal providing 17 g of protein and 12 g of fiber. What they found may surprise the non-paleo-lovers out there: "[The] beef-based meal with high protein and [the] bean-based meal with moderate protein and high fiber produced similar satiety, while the bean-based meal resulting in higher, yet moderate, gas and bloating" (Bonnema. 2015). Since both lead to a reduced energy intake on subsequent meals, both the anti-paleo legume-based and the paleo meat-based meal "could equate to weight loss and/or management over time" (ibid.).
After all, more than 50 million people in the US alone are suffering from full-blown hypertension (high blood pressure). In view of the fact that even pre-hypertension is associated with an 80% increased risk of cardiovascular morbidity (learn more), the consumption of a paleo-esque diet could thus save the lives of millions of people. In view of the fact that this would also save us billions of dollars that are spent on managing hypertension every year, this is probably the strongest argument in favor of the "paleo diet" (Note: It's not an exclusive advantage, though. The DASH diet with a similar if not higher vegetable and fruit content has similar effects).
Figure 3: Increase in all-cause mortality risk among 48 500 men and 56 343 women, 50 years or older, in the Cancer Prevention Study II Nutrition Cohort according to BMI and waist circumference (Jacobs. 2010).
A bit less convincing for the average panel member, but practically as relevant are the significant decreases in waist circumference. With studies showing a 2-fold elevated all-cause mortality risk in average American men and women with WC ≥120 cm (compared with <90 cm) and WC ≥110 cm (compared with <75 cm), respectively (see Figure 3 for details), there's yet little doubt that an improvement in this often overlooked health-marker is just as important as the reduction in blood pressure.
Bottom line: Even though we have to rely exclusively on the evidence of the four studies (Lindeberg. 2007; Jönsson. 2009; Boers. 2014; Mellberg. 2014), there's little doubt that paleo-esque diets are superior to many of the recommended "low fat + whole grain, ..."-diets. Unfortunately, the number of pertinent studies is small and the existing studies have short-comings the critics will always bring up as an objection when someone dares questioning the current recommendations:
  • Three out of the four existing RCTs, i.e. Lindeberg, Jönssen and Boers, either didn't account for inter-group differences at baseline or didn't report whether they did that or didn't do it (you can safely assume that they didn't, so that everyone can easily say that the paleo group had an unfair advantage and we cannot tell if this was or wasn't the case).
  • Adverse events were assessed only in one out of the four existing RCTs (in the Boers study) and otherwise completely ignored (in view of the accusations against "paleo" from the proponents of the current guidelines that's an important shortcoming).
  • The quality of life was not assessed by any of the studies (I don't say that the quality of life will suffer, but it is unquestionably important to assess it, also in view of the likeliness that people will adhere to the diet in the long run).
These issues, as well as the short the duration of three out of the four existing studies (only the Mellberg study lasted 2 years) are problems the "paleo research" will still have to overcome before any of the governing bodies / councils will say "paleo is the new recommended diet for XY" (insert "the average citizen of the European Union", "the average US citizen", etc. for XY).

No, there are not neg. side effects of high protein intakes. On the contrary, the major source of acids in the Western diets are grains which are obviously not allowed on "paleo diets" | more
In view of the fact that the analysis of secondary outcomes, like body weight development [subjects on paleo lost 2.69 (0.52-4.87) kg more], inflammation [subjects on paleo reduced their CRPs by 0.28 (0.21-0.76) mg/L more], fasting insulin [subjects on paleo had 13.03 (6.52-32.59) pmol/L lower levels], and total cholesterol [subjects on paleo had 0.24 (0.09- 0.56) mmol/L levels], yielded similar "pro-paleo" results, I personally think that it is very unlikely that future trials that avoid these problems would find very fundamentally different results and/or ill health effects of a liberal paleo-esque dietary template.

The fact that longer-term studies that account for baseline differences, measure adverse events and assess the quality of life of their subjects are not available, yet, is still holding "paleo" back from greater acceptance within the medical / research community. Plus: What I would like to see are studies that compare the different paleo varieties, as in "strict paleo" vs. "paleo + dairy" or "paleo + legumes"... but who knows, maybe someone is already working on one or several of these studies at the very moment today's SuppVersity article is published. | Comment on Facebook!
References:
  • Boers, Inge, et al. "Favourable effects of consuming a Palaeolithic-type diet on characteristics of the metabolic syndrome: a randomized controlled pilot-study." Lipids Health Dis 13.1 (2014): 160. 
  • Eaton, S. Bovn, M. Konner, and N. Paleolithic. "A consideration of its nature and current implications." N Engl j Med 312.5 (1985): 283-9.
  • Jacobs, Eric J., et al. "Waist circumference and all-cause mortality in a large US cohort." Archives of internal medicine 170.15 (2010): 1293-1301.
  • Jönsson, Tommy, et al. "Beneficial effects of a Paleolithic diet on cardiovascular risk factors in type 2 diabetes: a randomized cross-over pilot study." Cardiovasc Diabetol 8.35 (2009): 1-14.
  • Lindeberg, Staffan, et al. "A Palaeolithic diet improves glucose tolerance more than a Mediterranean-like diet in individuals with ischaemic heart disease." Diabetologia 50.9 (2007): 1795-1807.
  • Manheimer, et al. "Paleolithic nutrition for metabolic syndrome: systematic review and meta-analysis." American Journal of Clinical Nutrition (2015): Ahead of print.
  • Mellberg, Caroline, et al. "Long-term effects of a Palaeolithic-type diet in obese postmenopausal women: a 2-year randomized trial." European journal of clinical nutrition 68.3 (2014): 350-357.

Phosphatidic Acid Reduces Whey-Induced Acute Protein Synthesis - Rodent Study Appears to Suggest Antagonism Not Synergism Between PA & Whey - What's the Verdict?

$
0
0
If we take the study at hand as a bench-mark, it appears as if you cannot really recommend PA supplements to serious gymrats. Due to a bunch of short-comings and a lot of open questions, I have to caution you not to jump to preliminary & potentially flawed conclusions.
If you are a "regular" here, at the SuppVersity, you will have heard about the mTOR-promoting effects of Phosphatidic Acid (PA) before (learn more). If you've also been following the SV News on Facebook, you will also know that I have repeatedly highlighted that we need studies that go beyond the mere provision of phosphatidic acid to mouse or man and assess whether adding PA to whey will ameliorate the whey-protein induced increases in protein synthesis, muscle and strength gains. Why would that be important if we do have studies that indicate that PA is effective? Well, anyone who even remotely considers paying the $$$ for a PA product will already be taking whey protein. If adding PA on top of his whey protein shake does not yield extra benefits (or worse), he would - and I would even say he should - not spend extra cash on phosphatidic acid... but before we get to any conclusions, let's take a close look at the latest research.
Today, I must suggest you stick to the tried and proven, protein supplements

Are You Protein Wheysting?

5x More Than the FDA Allows!

More Protein ≠ More Satiety

Protein: Food or Supplement?

Protein Timing DOES Matter!

Less Fat, More Muscle!
To understand why one may even expect that there was a synergism between whey protein (or leucine) and phosphatidic acid, one has to be aware of the fact that both trigger mTOR, albeit via different pathways: While leucine activates mTOR through RAG GTPase, PA is thought to independently activate mTOR through competitive binding with the mTOR inhibitor FKBP38. As Mobley et al. point out in the introduction to their latest paper in the Journal of the ISSN it does thus "stand[...] to reason that whey protein could synergistically activate mTOR if co-ingested with PA" (Mobley. 2015). Accordingly, ...
"the purpose of this study was to examine if PA acutely increases anabolic signaling markers and muscle protein synthesis (MPS) in gastrocnemius with and without whey protein concentrate (WPC) supplementation" (Mobley. 2015).
In view of the fact that previous studies did not do a detailed analysis of the skeletal muscle transcriptomic response to PA and considering the fact that the latter may be important with respect to finding explanations for any - positive or negative - findings, Mobley et al. ran detailed analysis of the skeletal muscle mRNA response to PA and/or WPC, as well. Their goal was to assess whether PA or PA + whey would affect key genes involved in muscle mass maintenance (myostatin (Mstn) and p21Cip1), metabolism (PGC-1α and GLUT-4), and skeletal muscle atrophy (Atrogin-1 and MuRF-1). To get this data, the researchers randomly assigned male Wistar rats to four different treatments groups groups in which they were gavaged with one of the following "supplements":
  • control (CON) - 1 ml of tap water
  • phosphatidic acid (PA) - 0.029 g soy-derived PA (S-PA, Mediator®, ChemiNutra, Austin, TX, USA) suspended in 1 ml of tap water; this being a human equivalent dose of 1.5 g per the species conversion calculations of ReaganShaw et al. (learn more)
  • whey protein concentrate (WPC) - 0.193 g WPC (standardized to 80 %, donated graciously by C.M.L.) suspended in 1 ml of tap water; this being a human equivalent dose of 10 g 
  • combined (PA + WPC) - 0.029 g soy-derived PA + 0.193 g WPC suspended in 1 ml of tap water
Three hours post-feeding, the gastrocnemius muscle was removed and analyzed for markers of Akt-mTOR signaling, gene expression patterns related to skeletal muscle mass regulation and metabolism, and muscle protein synthesis (MPS) analysis (note: there was no training involved!).
Why is it important that there was no training involved? With training we'd have a third factor that affects protein synthesis and net muscle gains via the mTOR cascade. It is well possible that it does not make much of a difference and the results would be similar. In view of the fact that it is yet also possible that the results would be reversed, no athlete should make his supplement choices based on studies that do not involve a form of physical exercise that's at least remotely similar to his / her own training.
Figure 1: Effects of PA with or without the co-ingestion of WPC on skeletal muscle mRNA expression patterns. Legend: Data are presented as means ± standard error. Bars not sharing similar superscript letters are significantly different (p < 0.05 | Mobley. 2015).
In our discussion of the results, I'd like to start with the less controversial data (if there is any) in Figure 1. The figure depicts the 6 graphs that illustrate the skeletal muscle mRNA expression in response to the four different treatments. If you know something about reading graphs like this you will realize that the PA+WPC combo had a potentially anabolic advantage in terms of myostatin suppression. Just like the increase in glucose transporter GLUT-4, where the PA+WPC group shows significantly higher levels than any other group, this would be a clear sign of the expected beneficial synergism. However, no relevant differences were found for the potentially "atrophic" proteins MuRF-1 and atrogen-1 (learn more), and the mitochondria builder PGC-1a (for a discussion of the potential relevance of the significant increase of the cell-cycle arrest protein p21Cip1 in the PA only group see blue box).
Learn how satellite cells, domain sizes, myonuclei and myostatin limit the growth potential of your muscle in this SV Classic!
What do we make of the large increase in P21Clp1 mRNA? In view of the fact that the p21Cip1 gene is thought to promote satellite cell differentiation (Hawke. 2003a,b), one could argue that its increase in the PA group could be a harbinger of the reduced muscle protein synthesis in the whey condition. After all, any protein that goes to the myogenic precursor cells in the sarcoplasm is diverted away from the myoplasm and the myoblasts the scientists extracted from the rodents. If that's in fact case, it would be even more interesting to see a long-term study on PA + WPC. Eventually it would mean that PA may increase the recruitement of satellite cells. That's important not just for muscle repair, but also for growth.

In fact, a lack of new satellite cells which can form myonuclei will cause the domain sizes to increase to a critical level, where mostatin will stop further growth in order to prevent the muscle from becoming disfunctional, until new myonuclei have been formed from satellite cells.

So, if this process of muscle "restructuring" was triggered, promoted or enforced by PA this could be a huge plus. One that would be especially valuable for experienced athletes for whom the increase in domain sizes may in fact become a growth limiting factor. Unfortunately, all this remains speculative, until corresponding human long-term studies W/ will have been conducted.
If we think of the p21Cip1 elevation (see discussion in the blue box) as the "standby" for muscle gains, look at the increased myostatin levels and even the mTOR response in Figure 2 everything looks as if the study had hardly been necessary and the expected synergism was there. Unfortunately, the most straight forward marker of real-world benefits, the skeletal muscle protein synthesis (it's not a real-world benefit in and out of itself), tells us a very different story.
Figure 2: Effects of PA with or without the co-ingestion of WPC on mTOR-related signaling markers (a-f) and acute factional muscle protein synthesis (right hand side | Mobley. 2015).
If there was a synergism between whey and PA it does - and the data in Figure 2 leaves no doubt about that - not translate into increases in muscle protein synthesis. In fact, the addition of phosphatidic acid appears to blunt, not increase the acute influx of protein into the muscle. That may be a "shocking" revelation for some of you, but if you've been following the SuppVersity articles for a couple of month you will know that there's a disconnect between the increases in allegedly anabolic signalling molecules like mTOR & co and the actual rate of protein synthesis. That does not change the simple truth, though, that the data in Figure 2 (right) suggests that the provision of PA on top of whey protein impairs the protein anabolic effect of whey.
So, does this mean that phosphatidic acid is a supplemental non-starter? Let's not jump to conclusions we may regret, here. We are not only dealing with a preliminary rodent study, here, we are also dealing with a study without practically relevant study outcomes. Why's that? Well, you should remember that there are two disconnects when it comes to measuring mTOR, protein synthesis and actual muscle size & strength gains. I've already mentioned the first one: Increases in mTOR and related signalling proteins don't necessarily translate to increases in protein synthesis.

From previous SuppVersity articles you should yet also remember that increases in protein synthesis don't necessarily translate into significantly increased muscle gains, either (Burd. 2012 | learn more). Why's that? Well, I guess the answer is more complex than that, but one thing everyone should understand is that muscle gains are the difference between protein synthesis and breakdown. Whether the protein breakdown did in fact increase, though, is something the mere elevation of an allegedly catabolic signalling protein, i.e. MuRF1 (see Figure 1), in the study at hand cannot tell us reliably. What we'd really have to measure would be the net protein accrual (in sarcoplasm and myoplasm | see blue box) over 24h or more - a value that has not been determined in the study at hand. If we had this value and it was significantly lower with PA  + WPC, this would be a reason to be concerned.

On it's own PA has already proven that it works - even in humans, where it doubled the lean mass gains triggered albeit non-significant reductions in body fat at 50% of the dosage used in the study at hand. So, if anything, we may use this study to argue that adding PA to whey could be useless.
The lack of data on the net protein accrual is directly related to another problem Mobley et al. call the "limited post-feeding time point interrogation" and mean that you cannot tell what happens in days / weeks by measuring protein synthesis for a very short period at a "random" point after the ingestion of a supplement. Since we (b) also don't have data on the intramuscular PA levels and are (c) lacking data on different dosages of PA and/or WPC dosages as well as an exercise group (which could be a game changer), the only thing we can tell for sure is that future long-term human studies with relevant outcome markers, i.e. strength and muscle gains, as well as a resistance training component are needed before we can safely conclude that PA joins the ranks of the dozens of supplemental non-starters that have been celebrated in the absence of relevant scientific evidence as "the next best thing" in the past decades | Comment!
References:
  • Burd, Nicholas A., et al. "Greater stimulation of myofibrillar protein synthesis with ingestion of whey protein isolate v. micellar casein at rest and after resistance exercise in elderly men." British Journal of Nutrition 108.06 (2012): 958-962.
  • Hawke, Thomas J., Nan Jiang, and Daniel J. Garry. "Absence of p21CIP rescues myogenic progenitor cell proliferative and regenerative capacity in Foxk1 null mice." Journal of Biological Chemistry 278.6 (2003a): 4015-4020.
  • Hawke, Thomas J., et al. "p21 is essential for normal myogenic progenitor cell function in regenerating skeletal muscle." American Journal of Physiology-Cell Physiology 285.5 (2003b): C1019-C1027.
  • Mobley, C. Brooks, et al. "Effects of oral phosphatidic acid feeding with or without whey protein on muscle protein synthesis and anabolic signaling in rodent skeletal muscle." Journal of the International Society of Sports Nutrition 12.1 (2015): 32.

Is the "Fat Kid" Doomed to Stay Fat Forever? What's the Role of Physical Activity Within a Window of Opportunity?

$
0
0
How large is the impact of not being active on childhood, adolescent and adult obesity. Plus: Are there critical time periods in gestation, infancy childhood and adolescence?
You may have heard the claim that "fat cells form during childhood and puberty and stay forever" before, right? Well, if that's the case it would be logical to assume that our childhood may be a critical developmental windows in which we have the time-limited opportunity to shape or help shape our own or our kids body composition for the rest of our or their lives.

Scientists from Mater Health Services South Brisbane, the University College of London, and the Griffith University have now reviewed the relatively scarce experimental and abundant observational pertinent research in order to examine "the role of physical activity during periods of risk to reduce the probability of obesity onset and maintenance in adulthood" (Street. 2015).
Reduced obese individuals and other things related to "metabolic damage"

Chronic Dieting Can Make You Skinny Fat

Nasty insights into the YoYo-Effect

Is There Diet-Induced Metabolic Damage?

Energy Deficits Can Make Athletes Fat

Fat Cell Size, NAFLD & Reduced Obesity

Metabolic Damage - What's the Evidence?
Unfortunately, but not surprisingly, most of the experimental evidence comes from rodent studies. If we tried to summarize the results of these studies in a half-sentence it would say that they demonstrate general positive effects of early exercise on the outcomes for all animals irrespective of maternal obesity status or post-weaning diet.
"Although high-fat post-weaning diets resulted in generally fatter animals, the body composition, endocrine and immune system profiles of these animals were healthier than non-exercising high-fat diet animals and comparable to standard chow non-exercising animals" (Street. 2015).
Interestingly, these effects do not disappear when the animals stop exercising. Rather than that studies indicate that exercise at an early age can protect animals against obesity onset for 5 weeks following exercise cessation (Caruso. 2013) - that's quite impressive if we take into account that rodents have a much shorter lifespan and a rapid early development period compared to humans (five rodent weeks in the early life are similar to several human years).

In spite of the fact that we don't know for sure for how long these protective effects will last in humans, there's little doubt that the same up-regulation of markers associated with increases in the skeletal muscle mitochondrial function, of which scientists believe that they protect the young rodents from obesity, will occur in humans as well (Shindo. 2014). Luckily, this is not the only thing we already know about rodents and assume for humans. Here's more:
  • Figure 1: If rodents are exercise in "childhood" (3WK), already, they will be significantly leaner - irrespective of whether they are fed an obesogenic HFD or the regular SMD diet (Wagener. 2012).
    the earlier, the better - the earlier young rodents are exercised (e.g. in the rodent equivalent of childhood), the more pronounced the protective effect against adult obesity (Wagener. 2012) - as you can see in Figure 1 earlier exercise will also yield significantly reduced body fat levels on standard rodent chow (SMD - 3WK);
  • muscle & brain are involved - next to changes in the mitochondria, the "stay lean" effect is also mediated by changes in structure and/or function of brain regions involved in appetite regulation in mouse & man (Street. 2015); 
  • males benefit more than females - the benefits of early exercise appear to be more pronounced for male vs. female animals (Schroeder. 2010); whether that's due to the higher muscle mass remains to be elucidated
In view of the fact that corresponding studies in human beings are not just time-consuming and expensive, but could also be unethical (think of kids being randomly assigned to non-exercise groups getting fat and sick as adults), it is not surprising that most of the evidence from human studies is of observational nature. Much in line with the findings from rodent studies, it has been suggested that three critical periods are important for obesity onset before adulthood: gestation and early infancy, the adiposity rebound and adolescence.
"Each period is characterized by substantial yet qualitatively different changes in growth and maturation. The culmination of each period represents a milestone in development and a subsequent reduction in the developmental plasticity of the maturing system. Given the inherently greater plasticity of earlier periods, obesity risk later in the life course is greater if the pre-conditions for obesity are established and maintained early. Disrupting the trajectory of obesity during development is likely to pay dividends in adulthood with a healthier body composition and metabolic profile. The disrupting effect of physical activity is less well understood in relation to obesity risk during and following critical periods" (Street. 2015).
Let's briefly recap what we know about these periods and how exercise during gestation (obviously in this case the mother would exercise), early infancy and adolescence influence our obesity risk as adults:
  • Figure 2: Body fat levels according to quartiles of physical activity in late pregnancy (Harrod. 2014).
    Gestation - Physical activity during pregnancy has been associated with reduced odds of a large-for-gestational age (LGA) infant, as well as reduced risk of small-for-gestational age, which are both linked to increased obesity risks later in life. In addition, there is evidence of reduced body fat levels, but identical lean mass and a significantly reduced risk of macrosomia (=excessive body weight) in babies born to mothers with higher levels of physical activity during pregnancy.

    Overall, however, the existing evidence - specifically for strength training - is conflicting and we are far from fully understanding the complex interactions between physical exercise, nutrition during gestation and the weight and body composition of the newborn baby (a usual more does not necessarily help mor). What appears to be certain though is that if beneficial effects occur, those will last for at least 12-24 months (Mattran. 2011; Chu. 2013). In one study scientists even found significantly reduced obesity risks up to age 5 even if the physical activity of the mother was the only significant difference between the kids (Clapp. 1996)
  • Figure 3: Observational data shows that there is an inverse linear association between infant activity scores and body fat percentages as early as in year 1 (Li. 1995).
    Infancy - Although it is correct that our body composition in infancy is still largely influenced by our mother's physical activity during gestation, there's good evidence that an earlier achievement of gross motor milestones (sitting, crawling, etc.) gives us the activity headstart we need to stay lean. Based on the correlation between earlier motor milestones and lower subscapular and triceps skin-folds measurements of 12 month-old kids Street et al. conclude that  "more active infants depose less fat over the first year [...] because active energy expenditure has resulted in increased metabolic capacity".

    In contrast to rodents, the "early activity bonus" does not last long in humans. With 5 years "early active" children are no longer significantly leaner than their peers, unless they were continuously more active and/or were fed different diets.

    In spite of the fact that early life activity does not provide life-long protection against obesity, though, the experimental and observational evidence of an inverse relationship between physical activity and body fat levels in infancy (Li. 1995) highlights the importance of leading an "active life" - in the most general sense - as early as possible. This is also relevant, because activity builds, while inactivity "kills" muscle, which is in turn associated with a further reduction in physical activity: Overweight infants, for example, have been shown to reach motor milestones later than leaner counterparts (Slining. 2010). Now you've just learned about the link between these milestones and staying lean in a previous paragraph. Accordingly, you will know that this means that the "sweet", chubby babies and toddlers may be caught in a vicious cycle of "obesity > low activity > lower muscle > lower activity > more obesity > lower activity ... "even before the know what the word "activity" means.
    Figure 4: Normal body fat development during infancy (Street. 2015).
    This does not mean that babies have to be "ripped", but I guess we all have seen kids with body fat levels way beyond the normal ~30% at 6 months (see Figure 4). The real problem, however, occurs thereafter, when the slow and steady decline in body fat should be driven by increases in a kid's activity energy expenditure (AEE). The latter takes the role of the energetic needs of growing which have previously been every toddler's #1 energy consumer. If the growth process slows and "activity", which does by the way include "vocalization primarily in the form of crying [which] is the next greatest pre-ambulatory energy cost after the energy cost of growth" (Street. 2015), does not take it's place, obesity ensues.

    Obviously, you could counter that by calorically restricting your toddler, but this is (a) unhealthy and (b) the exact opposite of what the mums and dads do. In fact, way too many of them are priming their kids to become obese sugar addicts by giving their kids a sugar-sweetened beverage (a "healthy baby tea" *rofl*), whenever the kids utter a sound just to make them shut up do. It is thus no wonder that studies have linked infant temperaments that are characterized by negative affectivity/emotionality and a more frequent use of vocal signals such as crying and thus more frequent maternal feeding responses to increased fat gain (Baughcum. 1998; Darlington. 2006). That's alarming, even if it has not yet been conclusively shown that the two are causally and not just corollary related.
  • Does the Optimal Meal Frequency Depend on Age? Study Suggests: Kids Better Eat Often, Adolescents Rather Step Away From Their Sugary Sins - Quality Counts! Read more!
    Childhood - An important feature of childhood development, particularly in terms of its association with increased obesity risk, is a fall in body mass index (BMI) until about 5–7 years of age, which is followed by the so-called "adiposity rebound" (AR).

    The earlier this rebound occurs, i.e. the earlier kids start to become fat again, the higher their risk of obesity as late as adulthood (Whitaker. 1998; Taylor. 2004). More specifically, studies like Whitaker et al. (1998) show that "early gainers" have a 20% higher obesity risk later in life and an extra 20% risk if they were already overweight - or I should say "over-fat" - at the age of 5-7 years.

    It is thus only logical that studies show that obese pre-schoolers often become obese adults (Nader. 2012). Next to the Western junk-food diet, research findings in the recent decades support a relationship between increased obesity risk, low physical activity and high sedentary pursuits during childhood (Reilly. 2010).
    Figure 5: Risk increase / decrease of becoming an obese teenager for weight status at AR, maternal and paternal BMI during; I think it's quite telling that even the "medium" weight (=average kids) already have increased obesity risks, these days (data from Whitaker. 1998).
    A recent study by Schuster et al., for example, shows that "overweight fifth-graders were more likely to become obese if they had an obese parent (P < .001) or watched more television (P = .02)" (Schuster. 2014); and that's only the last in a series of studies suggesting that children who engage in more vigorous physical activity are at reduced risk of obesity, while children who are more sedentary are at a significantly greater risk of becoming obese in adolescence, which happens to be the next and last developmental step we're going to discuss in today's SuppVersity obesity feature.
  • Adolescence - Adolescence is a critical phase in the development of our fat stores. While the years before puberty are characterized by both fat cell hypertrophy (the fat cell size increases), hyperplasia (more fat cells are formed) and apoptosis (fat cells die), most experts agree that the number of apoptotic processes in our adipose tissue declines rapidly as we approach puberty.

    Figure 6: Difference of total fat mass of girls at age 10, 11, 12, 13; all values relative to girls who had a low and maintained a low activity levels (LL) - HH: high activity at baseline, low later, LH: low activity at baseline, high later, HL: high activity at baseline, low later (Völgyi. 2011).
    This decline in the adipose tissue turnover is really bad news and one of the reasons why scientists believe that the "critical window" from the headline of today's SuppVersity article closes during puberty:
    "It is generally thought that alteration in the size of fat cells in adulthood is achievable but maintenance of reduced fat cell size is likely to be difficult because of the mechanisms that may include, e.g. decreased leptin production. Furthermore, while an increase in adipo-cyte number is possible during adulthood, reversal of fat cell number does not occur. Consequently, adolescence represents an additional critical window when physical activity may affect obesity risk (reducing fat cell accretion) in ways it can-not during adulthood (reducing established fat cell number). " (Street. 2015)
    Since adolescence is also associated with an increase in lean mass, including skeletal muscle and bone, it is thus high time to start being, or - better - being even more active. After all, both muscle and bone mass are positively correlated with physical activity levels (Bailey. 1999; Völgyi. 2011).
A 2005 study by D'Andrea et al. shows significant increases in resting energy expenditure after large volume liposuction (all values expressed rel. to baseline). This is the exact opposite of what would happen if the same 4-5% of body fat had been lost by dieting and thus evidence that surgery may help people lose weight without setting them up for the yoyo effect even after the "window of opportunity" closed. 
Liposuction to the rescue! I am usually not a fan of cosmetic surgery, but in view of the fact that D’Andrea et al. (2005) were able to show that large-volume liposuction results in "a significantly improved insulin sensitivity, resting metabolic rate, serum adipocytokines, and inflammatory marker levels" in a clinical study conducted with 123 obese women, it is hard to ignore that the surgery knife may help even if the "Window of Opportunity" has closed, already. The reduction in REE in reduced obese individuals is after all one of the main reasons they regain weight (or struggle with weight regain for the rest of their life). If this problem is in fact triggered by the high amount of emptied fat cells that are left behind after losing more than 40lbs, it's only to assume that the surgical removal of fat cells would not lead to the same "pro-weight gain" problems.
  • If you take a look at the data in Figure 6 it's yet not too late to start being active in puberty. The previously sedentary girls in Völgyi's study (Figure 6 | LH) who started to exercise regularly during puberty, for example,  were similarly lean as their "always active" peers (HH). Probably because they expended more energy, but also because their exercise left them less hungry than their sedentary peers ... that sounds like bogus? Well, take a look at the reduced 24h energy intake Thivel et al. measured in youths who were locked in a metabolic chamber in response to high intensity exercise vs. sitting around (Thivel. 2012 | Figure 7)  - exercise does not make you hungry.
    Figure 7: Much in contrast to what you may expect, obese kids actually eat less, when they are forced to work out. In that, doing high intensity exercise (HIE) is more "satiating" than low intensity (Thivel. 2012).
    Now, if exercise curbs your appetite, while being sedentary increases it and its obesogenic consequences, which in turn reduce your willingness and ability to exercise, it is obvious what Street et al refer to when they are talking about "a two way street" (Street. 2015). It's the previously hinted at vicious cycle in which lower physical activity predisposes to obesity, while obesity in turn predisposes to even greater reductions in physical activity.

    In view of the previously referenced physiological peculiarities, adolescence appears to be the last stage in our development, where increased activity, alone, can go a long and consequential way. It is thus all the more important to break the cycle of being sedentary <> getting fatter before the transition into adulthood takes place. After all, the currently available research leaves little doubt that physical activity during adolescence will promote an adult body composition and metabolic profile that is associated with a reduced obesity risk, and reduced morbidity: Adult women who were more active adolescents, for example, are 50% less likely to be abdominally obese - even if all covariates are controlled for (da Silva. 2015). Physical activity interventions in adults, on the other hand, yield very ambiguous results. In most cases, however, being more active alone will not make a significant enough difference to trigger fat loss and instigate health improvements. 
Shi et al. conducted an interesting experiment that highlight the role of low leptin in weight regain. They fattened rodents up, dieted them down and found that the weight reduced rodents whose weight loss had stagnated after 3 weeks had the same low leptin levels as the normal-weight significantly leaner rodents. The hypothesis is that this is due to having more, but empty fat cells that produce way too little leptin for the total amount of body fat, because the amount of leptin that's produced depends in a non-linear way on the level of fat in the cells. Rodent bogus? Well several human studies showing a reversal of neurological, endocrine and metabolic abnormalities in reduced obese indiv. with leptin (Rosenbaum. 1997, 2005 & 2008) suggest that this may actually be happening in man & woman, too.
So what? With the vicious cycle of being sedentary, getting fat, being even more sedentary and getting even fatter, we are back to our original question which was whether you'd have to stay fat forever if you end up being fat at the end of puberty. I wouldn't go so far as to say that your fate is determined, but it's hard to ignore the evidence that our kids can at least avoid adding additional fat cells and thus increase their chance of life-long leanness by leading an active lifestyle. We, on the other hand are in a very compromised situation. In contrast to studies in adolescents, many studies in adults show that even combined aerobic and resistance training, may effectively shed our love-handles once we are adults (Willis. 2012).

Dieting, on the other hand, may successfully reduce our body weight, but the risk of "refilling" the fat cells we've created as babies, children and adolescents, when the body fat turnover and the natural "apoptotic death" of fat cells stagnates, increases with every pound of extra body fat we've "acquired" as babies, children and teens. Why exactly this is the case has not been fully elucidated, yet. I personally find that Shi's 2009 hypothesis that says (generally speaking) that the high number of small fat cells in people who have gained a lot of fat before adulthood are left with after a diet won't produce enough leptin to signal the body that they've achieved a new steady state. Constant hunger and rapid and easy fat gain even from consuming the "exact" amount of energy they should need are the nasty consequences some of you may have experienced first-hand | Comment!
References:
  • Bailey, D. A., et al. "A six‐year longitudinal study of the relationship of physical activity to bone mineral accrual in growing children: the University of Saskatchewan Bone Mineral Accrual Study." Journal of Bone and Mineral Research 14.10 (1999): 1672-1679.
  • Baughcum, Amy E., et al. "Maternal feeding practices and childhood obesity: a focus group study of low-income mothers." Archives of Pediatrics & Adolescent Medicine 152.10 (1998): 1010-1014.
  • Caruso, V., H. Bahari, and M. J. Morris. "The Beneficial Effects of Early Short‐Term Exercise in the Offspring of Obese Mothers are Accompanied by Alterations in the Hypothalamic Gene Expression of Appetite Regulators and FTO (Fat Mass and Obesity Associated) Gene." Journal of neuroendocrinology 25.8 (2013): 742-752.
  • Chu, Lisa, et al. "Impact of maternal physical activity and infant feeding practices on infant weight gain and adiposity." International journal of endocrinology 2012 (2012).
  • Clapp, James F. "Morphometric and neurodevelopmental outcome at age five years of the offspring of women who continued to exercise regularly throughout pregnancy." The Journal of pediatrics 129.6 (1996): 856-863.
  • da Silva Garcez, Anderson, et al. "Physical Activity in Adolescence and Abdominal Obesity in Adulthood: A Case-Control Study Among Women Shift Workers." Women & health ahead-of-print (2015): 1-13.
  • Darlington, Anne-Sophie E., and Charlotte M. Wright. "The influence of temperament on weight gain in early infancy." Journal of Developmental & Behavioral Pediatrics 27.4 (2006): 329-335.
  • Harrod, Curtis S., et al. "Physical activity in pregnancy and neonatal body composition: the healthy start study." Obstetrics & Gynecology 124.2, PART 1 (2014): 257-264.
  • Li, Ruowei, et al. "Relation of activity levels to body fat in infants 6 to 12 months of age." The Journal of pediatrics 126.3 (1995): 353-357.
  • Mattran, Kelly, et al. "Leisure-time physical activity during pregnancy and offspring size at 18 to 24 months." Journal of Physical Activity and Health 8.5 (2011): 655.
  • Nader, Philip R., et al. "Next steps in obesity prevention: altering early life systems to support healthy parents, infants, and toddlers." Childhood Obesity (Formerly Obesity and Weight Management) 8.3 (2012): 195-204.
  • Reilly, John J. "Low levels of objectively measured physical activity in preschoolers in child care." Medicine and science in sports and exercise 42.3 (2010): 502-507.
  • Rosenbaum, Michael, et al. "Effects of Weight Change on Plasma Leptin Concentrations and Energy Expenditure 1." The Journal of Clinical Endocrinology & Metabolism 82.11 (1997): 3647-3654.
  • Rosenbaum, Michael, et al. "Low-dose leptin reverses skeletal muscle, autonomic, and neuroendocrine adaptations to maintenance of reduced weight." Journal of Clinical Investigation 115.12 (2005): 3579.
  • Rosenbaum, Michael, et al. "Leptin reverses weight loss–induced changes in regional neural activity responses to visual food stimuli." The Journal of clinical investigation 118.7 (2008): 2583.
  • Schroeder, Mariana, et al. "Post-weaning voluntary exercise exerts long-term moderation of adiposity in males but not in females in an animal model of early-onset obesity." Hormones and behavior 57.4 (2010): 496-505.
  • Schuster, Mark A., et al. "Changes in obesity between fifth and tenth grades: A longitudinal study in three metropolitan areas." Pediatrics 134.6 (2014): 1051-1058.
  • Shi, Haifei, et al. "Diet‐induced Obese Mice Are Leptin Insufficient After Weight Reduction." Obesity 17.9 (2009): 1702-1709.
  • Shindo, Daisuke, Tomokazu Matsuura, and Masato Suzuki. "Effects of prepubertal-onset exercise on body weight changes up to middle age in rats." Journal of Applied Physiology 116.6 (2014): 674-682.
  • Slining, Meghan, et al. "Infant overweight is associated with delayed motor development." The Journal of pediatrics 157.1 (2010): 20-25.
  • Taylor, Rachael W., et al. "Rate of fat gain is faster in girls undergoing early adiposity rebound." Obesity research 12.8 (2004): 1228-1230.
  • Thivel, David, et al. "The 24-h energy intake of obese adolescents is spontaneously reduced after intensive exercise: a randomized controlled trial in calorimetric chambers." PloS one 7.1 (2012): e29840.
  • Wagener, A., A. O. Schmitt, and G. A. Brockmann. "Early and late onset of voluntary exercise have differential effects on the metabolic syndrome in an obese mouse model." Experimental and Clinical Endocrinology and Diabetes 120.10 (2012): 591.
  • Whitaker, Robert C., et al. "Early adiposity rebound and the risk of adult obesity." Pediatrics 101.3 (1998): e5-e5.

Nitrate for Muscle+Brain Performance | Walking for Glucose Management | Full Glycogen Stores W/Out Excessive Water Retention | 5x10, 10x10, Cardio How mTOR and Co Respond

$
0
0
If Yap et al. were right and only continuous and not accumulative physical activity mattered, activity trackers like the this would be useless. No one needs a device to remind him of the 30 min of brisk walking he did / skipped today.
In today's installment of SuppVersity "On Short Notice", we're going to take a closer look at a selection of recent papers from the European Journal of Applied Physiology. To be more specific, I will discuss the physiological and psychological effects of dietary nitrate and their potential significance for team athletes. From there we're taking a detour to glycogen resynthesis and its interaction with hydration - a topic that may be highly relevant for bodybuilders and at least interesting for everyone else. Before we then take a departing look at the differential effects of 5x10, 10x10 and endurance exercise on markers of protein synthesis and glucose uptake, we'll spend briefly review the claim that the cumulative physical activity (the one you measure w/ step counters) would lack the characteristic health benefits everyone expects from meeting his daily activity goals.
Read more about exercise-related studies at the SuppVersity

Tri- or Multi-Set Training for Body Recomp.?

Alternating Squat & Blood Pressure - Productive?

Pre-Exhaustion Exhausts Your Growth Potential

Full ROM ➯ Full Gains - Form Counts!

Body Pump, Cardio & Exercise Expenditure

Study Indicates Cut the Volume Make the Gains!
  • Dietary nitrate improves sprint performance and cognitive function during prolonged intermittent exercise - While anyone of you should know that nitrate from beetroots can have significant physiological effects, the observations Thompson et al. made in their recent double-blind randomised crossover study are probably real news and above all practically relevant for some of you and/or your clients from various athletic domains (Thompson. 2015).

    To investigate the effects of dietary NO3(-) supplementation on exercise performance and cognitive function, the scientists had 16 male team-sport players consume NO3(-)-rich (BR; 140 mL/day; 12.8 mmol of NO3(-)), and NO3(-)-depleted (PL; 140 mL day/1; 0.08 mmol NO3(-)) beetroot juice for 7 days (these are the regular shots you can buy at supplement stores | if you want to drink regular beetroot juice, you need 3-4x the amount). With the nitrate supplement being consumed over a one week period we are thus not talking about the effects of acute, but about the effects of chronic supplementation. Keep that in mind, if you buy one shot and don't feel the results immediately.

    On the test day the subjects completed a prolonged intermittent sprint test (IST) protocol (two 40-min "halves" of repeated 2-min blocks consisting of a 6-s "all-out" sprint, 100-s active recovery and 20 s of rest) on a cycle ergometer during which cognitive tasks were simultaneously performed.
    Figure 1: Comparison of total work during the sprints and reaction times during cognitive decision making tasks designed to emulate the cognitive tasks during team sports (Thompson. 2015).
    As you can see in Figure 1 both, the total work done during the IST, as well as the reaction times that were measured during cognitive tasks in the second half of the IST, were improved in the beetroot vs. placebo trial.

    Even though, the scientists didn't find a difference in response accuracy, the findings are highly relevant for any athlete who has to (a) perform at high intensities, while (b) maintaining optimal cognitive performance and decision-making reaction times. Who is that? Well, I'd say almost every team sport athlete of whom previous studies have shown that his / her cognitive acuity suffers during prolonged intermittent exercise. 
  • Extra water is not necessary for optimal glycogen replenishment after workouts - In fact, bodybuilders may want to avoid it... Avoid water? No, I am not saying you should not drink water at all, but if you look at the results of Valentín E. Fernández-Elías' recent "analysis of the relationship between muscle water and glycogen recovery after prolonged exercise in the heat in humans" you will see that too much water in the post-workout window may actually give you the 'watery' look some physique athletes like bodybuilders are trying to avoid.

    It is usually stated that glycogen is stored in human muscle bound to water in a proportion of 1:3 to 1:4 g. In their latest study, the scientists from the University of Castilla-La Mancha investigated this proportion in biopsy samples that were taken when their trained subjects recovered from prolonged exercise in the heat:
    "On two occasions, nine aerobically trained subjects (VO2max = 54.4 ± 1.05 mL/kg/min; mean ± SD) dehydrated 4.6 ± 0.2 % by cycling 150 min at 65 % VO2max in a hot-dry environment (33 ± 4 °C). One hour after exercise subjects ingested 250 g of carbohydrates in 400 mL of water (REHLOW) or the same syrup plus water to match fluid losses (i.e., 3170 ± 190 mL; REHFULL). Muscle biopsies were obtained before, 1 and 4 h after exercise" (Fernández-Elías. 2015).
    In contrast to what you may have expected, the muscle glycogen replenishment was not impaired by the lack of water in the REHLOW group. Ok, if you look at the data in Figure 2 right, there is a minimal advantage for the adequate water group, but this advantage is not statistically and almost certainly not practically relevant (79 ± 15 and 87 ± 18 g/kg dry muscle; P = 0.20).
    Figure 2: Muscle water content before and after dehydrating exercise and after 3 h recovery period (a). Muscle glycogen content before and after dehydrating exercise and after 4 h recovery period (b). Data is presented as mean ± SD. *Different from previous time point. †Different from REHFULL (P < 0.05 | Fernández-Elías. 2015).
    The thing that did differ between the adequat (REHFULL) and the inadequate (REHLOW) hydration trial, however, was the muscle water content which was significantly higher in the REHFULL than in the REHLOW trial (3814 ± 222 vs. 3459 ± 324 g/kg dm, respectively; P < 0.05; ES = 1.06).

    SuppVersity Suggested: "Hydrated or Dumb: Dehydration Affects Brain, Muscle and Other Vital Organs - Plus: 15+ Causes of Dehydration + Can the Color of Your Urine Tell You if You Drink Enough?" After reading this SV Classic and my recent article about the link between dehydration and type II diabetes you will probably stop thinking about using dehydration more than just occasionally.
    What's even more striking is that the scientists analysis of the ratio in which water and glycogen were stored in the two groups showed that subjects in the REHLOW trial stored the glycogen at the minimal 1:3 glycogen : water ratio, while their peers who got plenty of water exhibited a glycogen : water ratio of 1:17. Needless to say that this difference in water storage may be very important for bodybuilders during the last days and hours of their contest prep. In view of the importance of optimal hydration for your health, cognition and the hitherto unproven hypothesis that increases in cellular water may be involved in the hypertophy response to exercise (including the efficacy of creatine | Op‘t Eijnde. 2001), (non-)rehydration practices as they were used in the study at hand are nothing I would generally recommend. 
  • Study says: Only continuous, not accumulated 30 min of walking will improve your glucose sensitivity - While step counters suggest that all you have to do to improve your health is to take "X" steps per day, the conclusion of a recent study from the DSO National Laboratories in Singapore refutes the simple and beautiful idea that you can distribute the X number of steps you would usually take during 30 minutes of brisk walking over three or more small "exercise servings" and see the same benefits as you'd see with 30 minutes of continuous brisk walking:
    "These findings demonstrate that 30 min of brisk walking is sufficient to improve insulin sensitivity in healthy, young Asians but only continuous and not accumulated walking provides this benefit. " (Yap. 2015).
    In said study, twenty-five healthy participants (12 males) participated in an oral glucose tolerance test (OGTT) the morning after: (i) accumulating three 10 min bouts of walking the previous evening; (ii) walking continuously for 30 min the previous evening or; (iii) resting the previous evening. Blood samples were taken in the fasted state and for 2 h post-OGTT. The subjects' insulin sensitivity was estimated from fasting blood glucose and insulin using the quantitative insulin sensitivity check index (QUICKI) and in response to the OGTT using an insulin sensitivity index (ISI-Matsuda).
    Figure 3: Changes in fasting glucose, insulin and insulin sensitivity (QUICKI) the morning after accumulated walking, continuous walking or a rest day; values expressed rel. to sedentary control (Yap. 2015).
    Now, as you've read a few lines above, the scientists say: Only the continuous walking is beneficial. Well, I don't know about you, but if I look at the study results in Figure 1, I wouldn't say that the data suggests that only continuous brisk walking would be beneficial. In fact, the early morning glycemia, which is by the way a pretty stupid measure of glucose tolerance anyway (cortisol rises in the AM and ruins the results), is very similar and the OGTT data in Figure 2 shows no practically relevant effect or difference either.
    Figure 4: Glucose (a), insulin (b) and insulin sensitivity index (ISI-Matsuda) (c) calculated from an oral glucose tolerance test the morning after three 10 min bouts of accumulated brisk walking, a 30-min continuous brisk walk or resting the previous evening. Values are mean (SD) (n = 25). Main effect of time for glucose (a) and insulin (b) (both P < 0.001). Main effect of trial for ISI-Matsuda (c) with Bonferroni post hoc t tests: accumulated walking vs. continuous walking (P = 1.000); accumulated walking vs. rest (P = 0.204); continuous walking vs. rest (P = 0.081 | Yap. 2015)
    With that being said, you can still rely on your step counter as a guide to a health-relevant amount of activity. What is important is that you get your physical activity in; and not that you do it in a continuous matter (even though that may offer small benefits in the study at hand). Plus, you will remember: Especially for those with some extra-weight on their hips "Increasing Physical Activity Just as Effective as Strength, Endurance or Combined Exercise to Lose Fat and Build Muscle" | re-read the SV article.
Figure 5: Summary of exercise-induced responses in signaling proteins and their selected signaling pathways investigated in the present study. The figure is simplified, and not all the possible connections between the proteins are shown. Signaling proteins are marked according to the present findings of changes from pre-exercise to 30 min post-exercise within the group (Ahtiainen. 2015).
Are you missing something? Yes, the -TOR study. The one with the different exercise types and volume and the effects on the signaling pathways regulating skeletal muscle glucose uptake and protein synthesis after workouts. So why did this interesting paper not get more room? Well, the answer is simple: If you determine only markers of protein synthesis, glucose uptake & co in response to 5 × 10 repetition maximum (RM) resistance exercise (RE) with leg press device (5 × 10 RE; n = 8), 10 × 10 RE (n = 11), and endurance exercise (strenuous 50-min walking with extra load on a treadmill; EE; n = 8) you generate results with little practical relevance. After all, we know that an increase in mTOR phosphorylation does not tell us that the actual protein synthesis let alone the long-term gains increases, as well - since those were not assessed in the Ahtiainen paper, their results are rather of educational than practical value.

The educational value is thus also the reason I still mention the study. I mean, I didn't want to deny you the opportunity of looking at the scientists' excellent "summary of exercise-induced responses in signaling proteins and their selected signaling pathways" in Figure 5 - even though, the cause-and-effect relationships are still 'hypothetical' in parts ;-) | Comment on Facebook!
References:
  • Ahtiainen, Juha P., et al. "Exercise type and volume alter signaling pathways regulating skeletal muscle glucose uptake and protein synthesis." European journal of applied physiology (2015): 1-11.
  • Fernández-Elías, Valentín E., et al. "Relationship between muscle water and glycogen recovery after prolonged exercise in the heat in humans." European journal of applied physiology (2015): 1-8.
  • Op‘t Eijnde, B., et al. "Effect of creatine supplementation on creatine and glycogen content in rat skeletal muscle." Acta physiologica Scandinavica 171.2 (2001): 169-176.
  • Thompson, Christopher, et al. "Dietary nitrate improves sprint performance and cognitive function during prolonged intermittent exercise." European journal of applied physiology (2015): 1-10.
  • Yap, Mei Chan, Govindasamy Balasekaran, and Stephen F. Burns. "Acute effect of 30 min of accumulated versus continuous brisk walking on insulin sensitivity in young Asian adults." European journal of applied physiology (2015): 1-9.

Are You Afraid that the Fructose Boogieman Clogs Up Your Liver? Citrulline or Alanine, Glycine, Proline, Histidine and Aspartate Mix Will Protect You + Maybe Lean You Out

$
0
0
If you belong to the people who simply cannot stay away from HFCS foods and beverages, you may be happy to hear that the equivalent of as little as 10g citrulline or NEAAs in your diet may do much more than "just" fully prevent its negative effects on your liver.
You will probably remember from previous articles I wrote that NAFLD, or rather the development of non-alcoholic fatty liver disease, is one of the earliest markers of metabolic syndrome and beginning type II diabetes. In the Western obesity societies in North America and Europe, NAFLD is among the most common causes of chronic liver disease and its prevalence is increasing rampantly (Marchesini. 2001).

In spite of the fact that its development is most strongly linked to the consumption of a generally unhealthy, energetically dense diet, there are several lines of evidence which suggest that the ingestion of exorbitant amounts of fast-digesting fructose from high fructose corn syrup (HFCS) sweetened beverages or processed foods is one, if not the most reliable motor of its development (Volynets. 2012).
You can learn more about citrulline at the SuppVersity

Citrulline prevents muscle catablism more than leucine

Arginine & citrulline for blood lipid control

EAA, BCAA, or citrulline for anti-catabolism?

Glutamine not citrulline to heal the gut?

Citrulline to ignite fatty acid oxidataion?

High & low dose arginine ineffec- tive NO boosters
On a molecular level fructose has been shown to trigger the production of fat from glucose in the liver (de novo lipogenesis | DNL). It does so by activating certain enzymes via the sterol regulatory element binding protein-1c (SREBP1c) and/or the carbohydrate-responsive element-binding protein (ChREBP). In conjunction with the corollary hepatic oxidative stress and the subsequent increase in insulin resistance, the onslaught of readily absorbed fructose from processed foods and HFCS-sweetened beverages is thus  like gasoline on the fire of the obesogenic baseline diet some people refer to as the "standard american diet" (learn why the "SAD-diet" is so good at making you fat). On the whole, however, the accumulation of fatty streaks in the liver that's so characteristic of NAFLD is yet only the point of departure of the journey to the land of the super-obese type II diabetics.


Now this journey from slightly overweight to super-obese is a journey of which many previous studies studies already suggested that it could take a very different route if people consumed higher amounts of protein and/or certain amino acids (AAs):
  • Theytaz et al. (2012), for example, found a "liver cleansing" increase in VLDL-TG release by the liver with an essential AA-enriched diet, and
  • Bortolotti et al. (2012) showed that a protein-enriched diet can effectively reduce the fructose induced lipid accumulation in the liver through increased energy expenditure. 
As Prasanthi Jegatheesan et al. point out, "[t]hese beneficial effects of AAs or proteins may arise through lipid oxidation, decreased DNL, and modulation of genes involved in lipid metabolism" (Jegatheesan. 2015). Since citrulline is the precursor for the renal synthesis of Arg, which is known to improve insulin sensitivity and lipid metabolism, and has been shown to have beneficial effects on the level of plasma triglycerides and fat deposition in the liver, the authors of a recent study speculated that "Cit supplementations might [...] able to limit the development of fructose-induced NAFLD" (Jegatheesan. 2015). Morever, Jegatheesan et al. expected to see similar effects with other nonessential amino acids (NEAA), of which their own previous research had shown that they may offer similar anti-NAFLD effects.
Where's the control group? Previous studies show that diets which are supplemented with NEAAs (alanine, glycine, proline, aspartate, histidine, and serine) or citrulline have metabolic and nutritional effects similar to a regular control diet, alone (Osowska. 2006; Jegatheesan. 2015). The CNEAA group is thus the "control" group in the study at hand. That's "ok" and doesn't make the study results useless, but in view of the fact that the data in Figure 2 shows more than just an ameliorative effect of citrulline on NAFLD, I would have preferred a regular control group in which the rodents had been fed standard chow without added non-essential amino acids.
To confirm or falsify their hypotheses, the researchers randomized twenty-two rats into four groups on different diets:
  • CNEAA as in control - control diet without added fructose + 1g/kg non-essential amino acids (for humans that's roughly 11g per day | this was the control diet in the study at hand)
  • F as in fructose- control diet enriched with 60% fructose without supplements
  • FNEAA as in control + fructose - fructose enriched diet (F) + 1g/kg non-essential amino acids (which happens to be the control diet in the study at hand)
  • FCIT as in fructose + citrulline - fructose enriched diet (F) + 1g/kg citrulline
In that, it's important to note that the NEAA supplement contained isomolar amounts of the 6 AAs and was isonitrogenous to the Cit diet. So, a mere difference in the nitrogen content of the chow cannot explain the obvious differences that occurred over the course of the 8-week study period.
Figure 1: Relative changes in liver weight, hepatic triglyceride content as well as the liver markers AST, ALT and ALP a marker of kidney health  compared the "control" group (CNEAA | Jegatheesan. 2015)
A period, in which the rodents in the fructose enriched diet group (F) developed NAFLD. A fate the rats in the FCit and the FNEFA group did not share - even though the amount of fructose in their diets was exactly as high as it was in the F group.
Figure 2: Both FNEAA and FCit rodents had a better body composition than the rodents on the NEAA supplemented control diet, but the differences reached statistical sign. only compared to the fructose (F) group (Jegatheesan. 2015)
In that, it is unquestionably worth noting that we are not talking about a mere amelioration of the fructose induced damage. If you look at the data you will notice that the rodents with the alanine, glycine, proline, aspartate, histidine, and serine enhanced fructose enriched diets actually ended up having healthier livers than those on the non-fructose diet... if that's not convincing evidence that the commonly heard, and painfully overgeneralized claim that "fructose is the root cause of all metabolic diseases" is bogus, I don't know.

So, why would you even consider citrulline, if the NEAA combo is better for your liver? 

Well, the reason that the average physique enthusiast, may still choose citrulline as his "fructose buffer" of choice is easy: Firstly, the differences in terms of liver health are not really statistically significant. Secondly and more importantly, though, citrulline triggered a reduction in visceral and total fat mass and a relative increase lean mass that was not observed in the NEAA group. And let's be honest: Isn't this type of body recompositioning effect what many of you are striving for?

What is most astonishing though, is that you could have these fat loss and muscle gain effects not just despite, but maybe even because you're guzzling HFCS drinks all day (obviously we'd have to have a citrulline + baseline diet group to confirm that). If we assume that the results translate 1:1 to human beings, the one thing you had just ~10g of citrulline per day. Is this possible? Well, it is, but let's be honest with ourselves: The inter-group differences between the control and the citrulline + fructose were not statistically significant. So while there were improvements those were not pronounced enough to be of statistical significance even in rodents. It is thus not really surprising that you haven't heard of citrulline as the "get jacked" amino acid very often... even though, evidence that it can help you to get jacked does exist (more).
Bottom line: It is quite astonishing how commonly ignored correlates of high fructose intakes can turn an obesogenic liver killer into a regular energy supplier. I mean, look at the data in the study at hand: Where's the evidence that fructose is worse than any other energy source, when a simple increase in NEAA or citrulline intake does not just nullify its effects but has the rodents on the 60% fructose diet end up leaner and with lower liver fat and better AST and ALT levels than their peers on the control diet (these differences are only partly statistically sign., though).

Citrulline & Glutathione - GSH Amplifies & Prolongs CIT's NO Boosting Effects During + After Biceps Workout | learn more.
So, just as Jegatheesan et al. say: When combined with NEAAs or citrulline, fructose is not just harmless, but can even "produced an overall change in nutritional and metabolic status, with lower body weight and altered body composition, [in spite of identical" food/energy [...] among groups" (Jegatheesan. 2015). Unfortunately, the precise mechanisms involved still need to be investigated. Jegetheesan et al. are yet relatively convinced that NEAAs and citrulline act via different pathways: "NEAAs may act through GCN2, citrulline could act on the liver via PPARa and the down-regulation of SREBP1c, for example, via protein kinase B and mTOR pathway, but also via the improved insulin sensitivity enabled by peripheral Arg bioavailability" (ibid). Just as it is the case for the applicability in humans, though, these hypotheses require future experimental verification | Comment!
References:
  • Bortolotti, Murielle, et al. "Effects of dietary protein on lipid metabolism in high fructose fed humans." Clinical Nutrition 31.2 (2012): 238-245.
  • Jegatheesan, Prasanthi, et al. "Effect of specific amino acids on hepatic lipid metabolism in fructose-induced non-alcoholic fatty liver disease." Clinical Nutrition (2015).
  • Jegatheesan, Prasanthi, et al. "Citrulline and Nonessential Amino Acids Prevent Fructose-Induced Nonalcoholic Fatty Liver Disease in Rats." The Journal of Nutrition (2015): jn218982.
  • Marchesini, Giulio, et al. "Nonalcoholic fatty liver disease a feature of the metabolic syndrome." Diabetes 50.8 (2001): 1844-1850.
  • Osowska, Sylwia, et al. "Citrulline modulates muscle protein metabolism in old malnourished rats." American Journal of Physiology-Endocrinology and Metabolism 291.3 (2006): E582-E586.
  • Theytaz, Fanny, et al. "Effects of supplementation with essential amino acids on intrahepatic lipid concentrations during fructose overfeeding in humans." The American journal of clinical nutrition 96.5 (2012): 1008-1016.
  • Volynets, Valentina, et al. "Nutrition, intestinal permeability, and blood ethanol levels are altered in patients with nonalcoholic fatty liver disease (NAFLD)." Digestive diseases and sciences 57.7 (2012): 1932-1941.
Viewing all 1497 articles
Browse latest View live


Latest Images